
Page 271 - Build Your Own Transistor Radios a Hobbyists Guide to High-Performance and Low-Powered Radio Circuits
P. 271
r-
n
u
IJ
u'
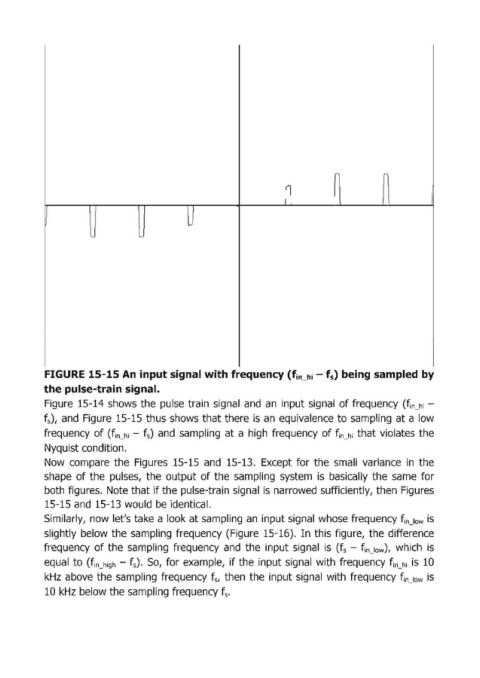
FIGURE 15-15 Ап, input signal with frequency (f iП _ hi - f ) being sampled Ьу
s
the pulse-train signal.
iП
Figuгe 15-14 shows the pulse tгain signal and ап input signal of frequency (f _ h1 -
f ), and Figuгe 15-15 thus shows that there is ап equivalence to sampling at а low
s
iП hi
iП hi
fгequency of (f _ - f ) and sampling at а high fгequency of f _ that violates the
s
Nyquist condition
Now сотраге the Figures 15-15 and 15-13. Except foг the small vaгiance in the
shape of the pulses, the output of the sampling system is basically the same foг
both figures. Note that if the pulse-train signal is narrowed sufficiently, then Figures
15-15 and 15-13 would Ье identical.
5imilarly, now let's take а look at sаmрliпg ап input signal whose frequency fiпJоw is
slightly below the sampling fгеquепсу (Figure 15-16). In this figure, t,he difference
fгequency of the sampling frequency and the input sigлаl is (f - finJow), which is
s
equal to (fiп_high - f s ). 50, for example, if the input signal with frequency f iП _ hi is 10
kHz above the sampling fгequency f Sf then the iпрut signal with fгequency finJow is
10 kHz below the sampling frequency f .
s