
Page 268 - Build Your Own Transistor Radios a Hobbyists Guide to High-Performance and Low-Powered Radio Circuits
P. 268
and using Equation (15-8), then
VщlJt) = [У р siп(Э)] Х P(t)
which agrees with Figures 15-7, 15-9, and 15-11 for е = О, 90, and 270 degrees.
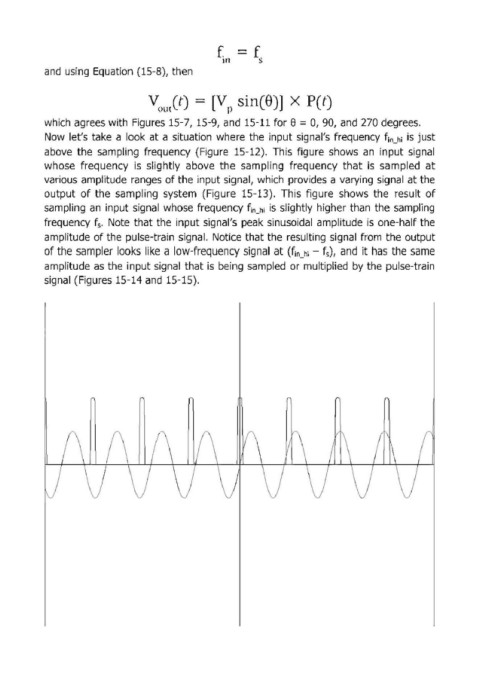
Now let's take а look at а situation where the input signal's frequency f;o_h; is just
above the sampling frequency (Figure 15-12). This figure shows ап input signal
whose frequency is slightly above the sampling frequency that is sampled at
various amplitude ranges of the input signal, which provides а varying signal at the
output of the sampling system (Figure 15-13). This figure shows the result of
sampling ап input signal whose frequency f;o h; is slightly higher than the sampling
frequency f . Note that the input signal's peak sinusoidal amplitude is one-half the
s
amplitude of the pulse-train signal. Notice that the resulting signal from the output
of the sampleг looks like а low-fгequency signal at (f;n_h; - f ), and it has the same
s
amplitude as the input signal that is being sampled ог multiplied Ьу the pulse-train
signal (Figures 15-14 and 15-15).