
Page 308 - Build Your Own Transistor Radios a Hobbyists Guide to High-Performance and Low-Powered Radio Circuits
P. 308
Foг Equation (16-17), the tгigonometгic identity sin(o) - sin(~) = 2[cos(0 1
b)j2][sin(0 - b)j2] will Ье useful in deteгmining the magnitude (MAG) of the
loweг-sideband signal. Thus
J
ог equivalently,
_ . 1 1· .
-a.,t 1_ = I i
I -
2
If the phase angle of siп(2пfct - 2пfmОd t) is О, then the гesidual magnitude of the
lower-sideband signal is
f - [in 21Т t - 21Т Пlti + - in 2'71' .t - 2'71' П10/ + <р = i l l[2 inTJI = I in-zl
16-1
Foг smalll angles of Ll«>, sin(Llq» = L1q>; thus
theгefoгe,
J.MA r in 211 - 211f t +. - in 211ft - 21Тf t + <Р ] = '.!Д<РI = IE...!..."'I ·ц>1
2 г. Ш(U . т( 2 ")
1 -1 )
Thus the residual lower-sideband signal has а magnitude of (У2) L1q>, where L1q> is
measured in radians. For example, if the Q phase еггог is 0.573 deQlree, ог 0.01
radian, then the residual sideband will Ье (1/2)(0.01) = 0.005, ог 0.5 percent, of the
upper-sideband sigпаl's amplitude.
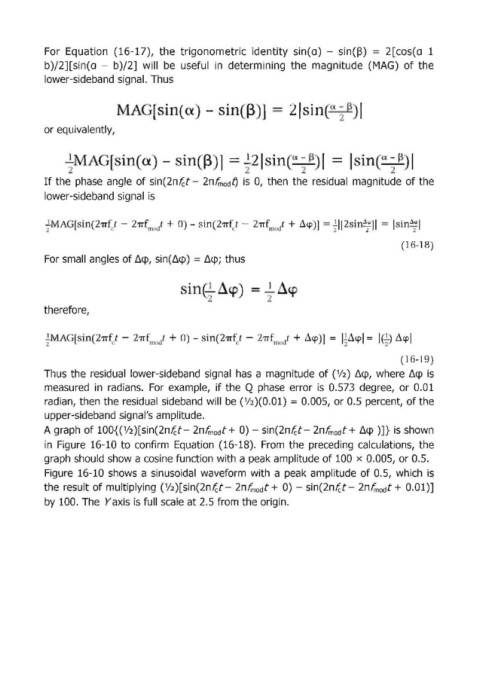
А graph of 100{('/2)[siп(2пfct- 2пfmоdt + О) - siп(2пfct- 2пfmоdt + L1q> )]} is shown
in Figure 16-10 to confirm Equation (16-18). From the ргесеdiпg саlсulаtiопs, the
graph should show а соsiпе fuпctiоп with а peak amplitude of 100 х 0.005, ог 0 .. 5.
Figure 16-10 shows а sinusoidal waveform with а peak amplitude of 0.5, which is
the гesult of multiplying (V2)[siп(2пfct- 2пf mоd t + О) - siп(2пfct- 2пfmОdt + 0.01)]
Ьу 100. The Yaxis is full scale at 2.5 from the огigiп .