
Page 27 - Building A Succesful Board-Test Strategy
P. 27
What Is a Test Strategy? 13
Stimulus
and | Shared
Response 1 Vectors
Vectors
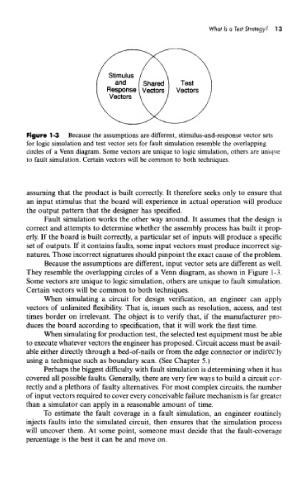
Figure 1-3 Because the assumptions are different, stimulus-and-response vector sets
for logic simulation and test vector sets for fault simulation resemble the overlapping
circles of a Venn diagram. Some vectors are unique to logic simulation, others are unique
to fault simulation. Certain vectors will be common to both techniques.
assuming that the product is built correctly. It therefore seeks only to ensure that
an input stimulus that the board will experience in actual operation will produce
the output pattern that the designer has specified.
Fault simulation works the other way around. It assumes that the design is
correct and attempts to determine whether the assembly process has built it prop-
erly. If the board is built correctly, a particular set of inputs will produce a specific
set of outputs. If it contains faults, some input vectors must produce incorrect sig-
natures. Those incorrect signatures should pinpoint the exact cause of the problem.
Because the assumptions are different, input vector sets are different as well.
They resemble the overlapping circles of a Venn diagram, as shown in Figure 1-3.
Some vectors are unique to logic simulation, others are unique to fault simulation.
Certain vectors will be common to both techniques.
When simulating a circuit for design verification, an engineer can apply
vectors of unlimited flexibility. That is, issues such as resolution, access, and test
times border on irrelevant. The object is to verify that, if the manufacturer pro-
duces the board according to specification, that it will work the first time.
When simulating for production test, the selected test equipment must be able
to execute whatever vectors the engineer has proposed. Circuit access must be avail-
able either directly through a bed-of-nails or from the edge connector or indirectly
using a technique such as boundary scan. (See Chapter 5.)
Perhaps the biggest difficulty with fault simulation is determining when it has
covered all possible faults. Generally, there are very few ways to build a circuit cor-
rectly and a plethora of faulty alternatives. For most complex circuits, the number
of input vectors required to cover every conceivable failure mechanism is far greater
than a simulator can apply in a reasonable amount of time.
To estimate the fault coverage in a fault simulation, an engineer routinely
injects faults into the simulated circuit, then ensures that the simulation process
will uncover them. At some point, someone must decide that the fault-coverage
percentage is the best it can be and move on.