
Page 61 - Building A Succesful Board-Test Strategy
P. 61
What Is a Test Strategy? 47
Floppy disk drives provide a perfect example. During disk formatting, the
heads of a floppy drive lay down tracks in a predetermined pattern so that they
can later write and read data reliably. Specifications include a target head position
for each track, along with "slop"—a tolerance—to prevent crosstalk between
tracks and head drift as the drive ages from making previously written informa-
tion unreadable.
Production testing must ensure not only that a particular drive can read
what it writes, but also that it can read a purchased disk or a disk created
on another drive in the same or another computer. Therefore, test tolerances must
be considerably narrower than the tolerances permitted during normal drive
operation.
Similarly, whatever tolerances permit a drive to pass during testing, manu-
facturing and test engineers must know whether drives emerge from the produc-
tion process sufficiently close to tolerance limits that further drift would cause them
to fail during additional testing or after a period of life with customers. CD
burners, when dealing with read-write disks (which use a totally different data
format from CD-ROMs) can experience these same problems.
Once a process achieves zero failures, manufacturers set up two tiers of test
tolerances. Exceeding the narrower set indicates a developing process problem,
which can be addressed before production-line units actually begin failing.
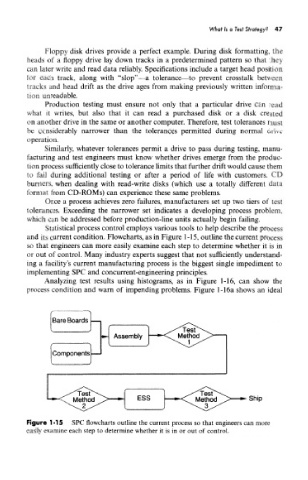
Statistical process control employs various tools to help describe the process
and its current condition. Flowcharts, as in Figure 1-15, outline the current process
so that engineers can more easily examine each step to determine whether it is in
or out of control. Many industry experts suggest that not sufficiently understand-
ing a facility's current manufacturing process is the biggest single impediment to
implementing SPC and concurrent-engineering principles.
Analyzing test results using histograms, as in Figure 1-16, can show the
process condition and warn of impending problems. Figure 1-16a shows an ideal
Bare Boards
M Assembly
Components
s >
Ship
Figure 1-15 SPC flowcharts outline the current process so that engineers can more
easily examine each step to determine whether it is in or out of control.