
Page 62 - Building A Succesful Board-Test Strategy
P. 62
48 BUILDING A SUCCESSFUL BOARD-TEST STRATEGY
B
) Center around mean ~i 2o
) Center away from mean
o o o o o o i* L. ,«n,. n,n . , . ! $ 10 nl -a3.1 .-ItnLirrT"! i
!
A*
™
Occurrences \ _^ V- _ 1 J 1 (0 i ZZ — _. i i
Ow •
W -J/V
o5 25
n
C OA:
U
3 * :
o -|5
;
5
5 1 7
3
1
C) Flat peak 9 11 "13 5 f(M 7 9 11
D) Bimodal (binning)
* I in
w — "TIT w 25 : ^»- ri_ i i
30
8 25 ijj g 20
2
i ° j i
J- «|K. ~l § 15
3 «*>
O 8 10
r ° 5 fi:.i_. j
o 1fl-
o 10
L ,n ',.LI; [L i
1 3 5 I 7 9 11 13 5 I 7 9 11
mean
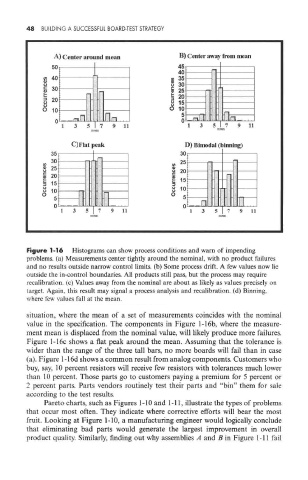
Figure 1-16 Histograms can show process conditions and warn of impending
problems, (a) Measurements center tightly around the nominal, with no product failures
and no results outside narrow control limits, (b) Some process drift. A few values now lie
outside the in-control boundaries. All products still pass, but the process may require
recalibration. (c) Values away from the nominal are about as likely as values precisely on
target. Again, this result may signal a process analysis and recalibration. (d) Binning,
where few values fall at the mean,
situation, where the mean of a set of measurements coincides with the nominal
value in the specification. The components in Figure l-16b, where the measure-
ment mean is displaced from the nominal value, will likely produce more failures.
Figure 1-16c shows a flat peak around the mean. Assuming that the tolerance is
wider than the range of the three tall bars, no more boards will fail than in case
(a). Figure l-16d shows a common result from analog components. Customers who
buy, say, 10 percent resistors will receive few resistors with tolerances much lower
than 10 percent. Those parts go to customers paying a premium for 5 percent or
2 percent parts. Parts vendors routinely test their parts and "bin" them for sale
according to the test results.
Pareto charts, such as Figures 1-10 and 1-11, illustrate the types of problems
that occur most often. They indicate where corrective efforts will bear the most
fruit. Looking at Figure 1-10, a manufacturing engineer would logically conclude
that eliminating bad parts would generate the largest improvement in overall
product quality. Similarly, finding out why assemblies A and B in Figure 1-11 fail