
Page 63 - Building A Succesful Board-Test Strategy
P. 63
What Is a Test Strategy? 49
Scatter diagram
55^
X
50 H
OT
Q 35
® 30
25
-Q
O
CD
10
1 2 3 4 5 6 7
Weeks since pick-and-place calibration
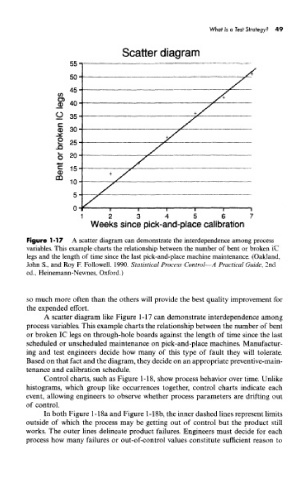
Figure 1-17 A scatter diagram can demonstrate the interdependence among process
variables. This example charts the relationship between the number of bent or broken 1C
legs and the length of time since the last pick-and-place machine maintenance. (Oakland,
John S., and Roy F. Followell. 1990. Statistical Process Control—A Practical Guide, 2nd
ed., Heinemann-Newnes, Oxford.)
so much more often than the others will provide the best quality improvement for
the expended effort.
A scatter diagram like Figure 1-17 can demonstrate interdependence among
process variables. This example charts the relationship between the number of bent
or broken 1C legs on through-hole boards against the length of time since the last
scheduled or unscheduled maintenance on pick-and-place machines. Manufactur-
ing and test engineers decide how many of this type of fault they will tolerate.
Based on that fact and the diagram, they decide on an appropriate preventive-main-
tenance and calibration schedule.
Control charts, such as Figure 1-18, show process behavior over time. Unlike
histograms, which group like occurrences together, control charts indicate each
event, allowing engineers to observe whether process parameters are drifting out
of control
In both Figure 1-18a and Figure 1-18b, the inner dashed lines represent limits
outside of which the process may be getting out of control but the product still
works. The outer lines delineate product failures. Engineers must decide for each
process how many failures or out-of-control values constitute sufficient reason to