
Page 168 - Buried Pipe Design
P. 168
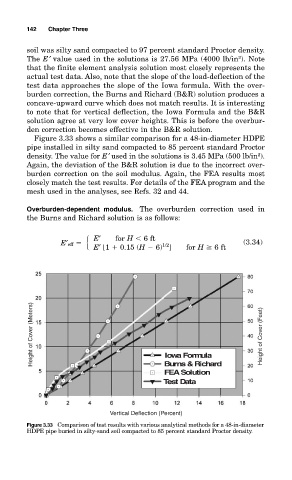
142   Chapter Three

         soil was silty sand compacted to 97 percent standard Proctor density.
                                                                   2
         The E′ value used in the solutions is 27.56 MPa (4000 lb/in ). Note
         that the finite element analysis solution most closely represents the
         actual test data. Also, note that the slope of the load-deflection of the
         test data approaches the slope of the Iowa formula. With the over-
         burden correction, the Burns and Richard (B&R) solution produces a
         concave-upward curve which does not match results. It is interesting
         to note that for vertical deflection, the Iowa Formula and the B&R
         solution agree at very low cover heights. This is before the overbur-
         den correction becomes effective in the B&R solution.
           Figure 3.33 shows a similar comparison for a 48-in-diameter HDPE
         pipe installed in silty sand compacted to 85 percent standard Proctor
         density. The value for E′ used in the solutions is 3.45 MPa (500 lb/in ).
                                                                        2
         Again, the deviation of the B&R solution is due to the incorrect over-
         burden correction on the soil modulus. Again, the FEA results most
         closely match the test results. For details of the FEA program and the
         mesh used in the analyses, see Refs. 32 and 44.

         Overburden-dependent modulus. The overburden correction used in
         the Burns and Richard solution is as follows:


                   E′ eff
  E′  for H
 6 ft                    (3.34)
                                              1/2
                            E′ [1   0.15 (H   6) ]   for H   6 ft


           Height of Cover (Meters)                                      Height of Cover (Feet)


                                               Iowa Formula
                                               Burns & Richard
                                               FEA Solution
                                               Test Data


                                 Vertical Deflection (Percent)
         Figure 3.33 Comparison of test results with various analytical methods for a 48-in-diameter
         HDPE pipe buried in silty-sand soil compacted to 85 percent standard Proctor density.