
Page 170 - Buried Pipe Design
P. 170
144 Chapter Three
E
Cover Height (Meters) Cover Height (Feet)
Vertical Deflection (Percent)
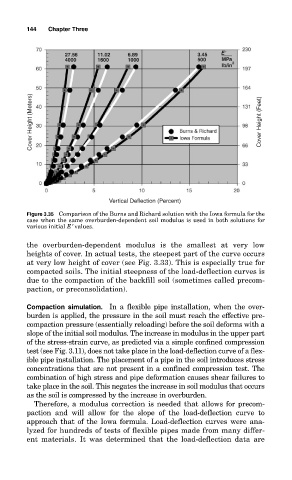
Figure 3.35 Comparison of the Burns and Richard solution with the Iowa formula for the
case when the same overburden-dependent soil modulus is used in both solutions for
various initial E′ values.
the overburden-dependent modulus is the smallest at very low
heights of cover. In actual tests, the steepest part of the curve occurs
at very low height of cover (see Fig. 3.33). This is especially true for
compacted soils. The initial steepness of the load-deflection curves is
due to the compaction of the backfill soil (sometimes called precom-
paction, or preconsolidation).
Compaction simulation. In a flexible pipe installation, when the over-
burden is applied, the pressure in the soil must reach the effective pre-
compaction pressure (essentially reloading) before the soil deforms with a
slope of the initial soil modulus. The increase in modulus in the upper part
of the stress-strain curve, as predicted via a simple confined compression
test (see Fig. 3.11), does not take place in the load-deflection curve of a flex-
ible pipe installation. The placement of a pipe in the soil introduces stress
concentrations that are not present in a confined compression test. The
combination of high stress and pipe deformation causes shear failures to
take place in the soil. This negates the increase in soil modulus that occurs
as the soil is compressed by the increase in overburden.
Therefore, a modulus correction is needed that allows for precom-
paction and will allow for the slope of the load-deflection curve to
approach that of the Iowa formula. Load-deflection curves were ana-
lyzed for hundreds of tests of flexible pipes made from many differ-
ent materials. It was determined that the load-deflection data are