
Page 266 - Buried Pipe Design
P. 266
Design of Pressure Pipes 237
taken as the lesser value computed using Eqs. (4.23) and (4.24) by
Molin and Spangler.
PD t y
6 (4.23)
2tE D D
PD 3K b WDt
(4.24)
3
2tE 3K x PD Et 3
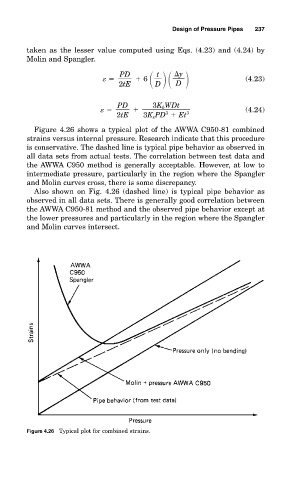
Figure 4.26 shows a typical plot of the AWWA C950-81 combined
strains versus internal pressure. Research indicate that this procedure
is conservative. The dashed line is typical pipe behavior as observed in
all data sets from actual tests. The correlation between test data and
the AWWA C950 method is generally acceptable. However, at low to
intermediate pressure, particularly in the region where the Spangler
and Molin curves cross, there is some discrepancy.
Also shown on Fig. 4.26 (dashed line) is typical pipe behavior as
observed in all data sets. There is generally good correlation between
the AWWA C950-81 method and the observed pipe behavior except at
the lower pressures and particularly in the region where the Spangler
and Molin curves intersect.
Figure 4.26 Typical plot for combined strains.