
Page 195 -
P. 195
194 Part II • Descriptive Analytics
Application Case 4.6 (Continued)
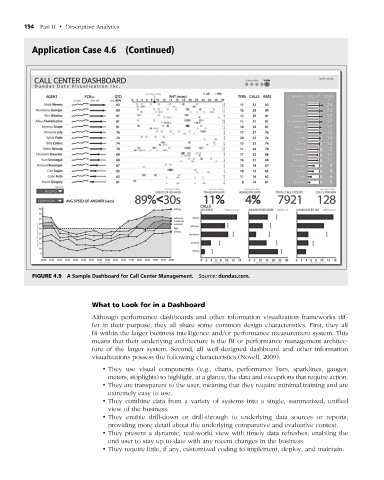
figuRe 4.9 A Sample Dashboard for Call Center Management. Source: dundas.com.
What to look for in a Dashboard
Although performance dashboards and other information visualization frameworks dif-
fer in their purpose, they all share some common design characteristics. First, they all
fit within the larger business intelligence and/or performance measurement system. This
means that their underlying architecture is the BI or performance management architec-
ture of the larger system. Second, all well-designed dashboard and other information
visualizations possess the following characteristics (Novell, 2009):
• They use visual components (e.g., charts, performance bars, sparklines, gauges,
meters, stoplights) to highlight, at a glance, the data and exceptions that require action.
• They are transparent to the user, meaning that they require minimal training and are
extremely easy to use.
• They combine data from a variety of systems into a single, summarized, unified
view of the business.
• They enable drill-down or drill-through to underlying data sources or reports,
providing more detail about the underlying comparative and evaluative context.
• They present a dynamic, real-world view with timely data refreshes, enabling the
end user to stay up to date with any recent changes in the business.
• They require little, if any, customized coding to implement, deploy, and maintain.
M04_SHAR9209_10_PIE_C04.indd 194 1/25/14 7:34 AM