
Page 191 -
P. 191
190 Part II • Descriptive Analytics
4.6 peRfoRMAnCe DAshBoARDs
Performance dashboards are common components of most, if not all, performance man-
agement systems, performance measurement systems, BPM software suites, and BI plat-
forms. Dashboards provide visual displays of important information that is consolidated
and arranged on a single screen so that information can be digested at a single glance
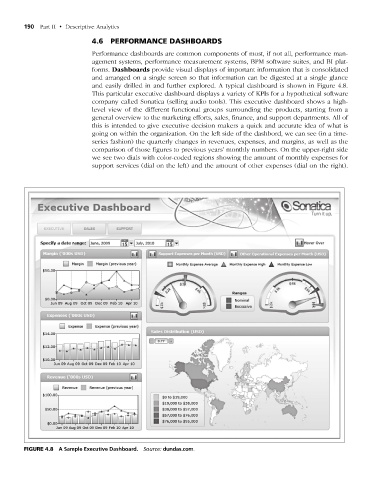
and easily drilled in and further explored. A typical dashboard is shown in Figure 4.8.
This particular executive dashboard displays a variety of KPIs for a hypothetical software
company called Sonatica (selling audio tools). This executive dashboard shows a high-
level view of the different functional groups surrounding the products, starting from a
general overview to the marketing efforts, sales, finance, and support departments. All of
this is intended to give executive decision makers a quick and accurate idea of what is
going on within the organization. On the left side of the dashbord, we can see (in a time-
series fashion) the quarterly changes in revenues, expenses, and margins, as well as the
comparison of those figures to previous years’ monthly numbers. On the upper-right side
we see two dials with color-coded regions showing the amount of monthly expenses for
support services (dial on the left) and the amount of other expenses (dial on the right).
figuRe 4.8 A Sample Executive Dashboard. Source: dundas.com.
M04_SHAR9209_10_PIE_C04.indd 190 1/25/14 7:34 AM