
Page 190 -
P. 190
Chapter 4 • Business Reporting, Visual Analytics, and Business Performance Management 189
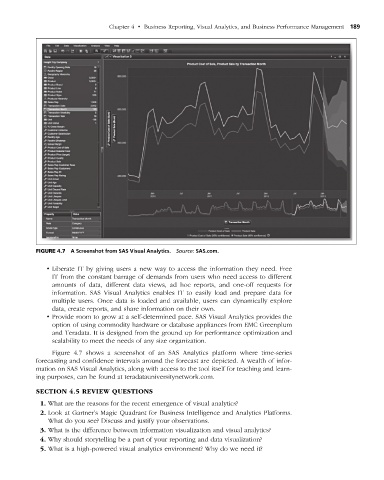
figuRe 4.7 A Screenshot from SAS Visual Analytics. Source: SAS.com.
• Liberate IT by giving users a new way to access the information they need. Free
IT from the constant barrage of demands from users who need access to different
amounts of data, different data views, ad hoc reports, and one-off requests for
information. SAS Visual Analytics enables IT to easily load and prepare data for
multiple users. Once data is loaded and available, users can dynamically explore
data, create reports, and share information on their own.
• Provide room to grow at a self-determined pace. SAS Visual Analytics provides the
option of using commodity hardware or database appliances from EMC Greenplum
and Teradata. It is designed from the ground up for performance optimization and
scalability to meet the needs of any size organization.
Figure 4.7 shows a screenshot of an SAS Analytics platform where time-series
forecasting and confidence intervals around the forecast are depicted. A wealth of infor-
mation on SAS Visual Analytics, along with access to the tool itself for teaching and learn-
ing purposes, can be found at teradatauniversitynetwork.com.
sectiOn 4.5 revieW QuestiOns
1. What are the reasons for the recent emergence of visual analytics?
2. Look at Gartner’s Magic Quadrant for Business Intelligence and Analytics Platforms.
What do you see? Discuss and justify your observations.
3. What is the difference between information visualization and visual analytics?
4. Why should storytelling be a part of your reporting and data visualization?
5. What is a high-powered visual analytics environment? Why do we need it?
M04_SHAR9209_10_PIE_C04.indd 189 1/25/14 7:34 AM