
Page 186 -
P. 186
Chapter 4 • Business Reporting, Visual Analytics, and Business Performance Management 185
Challengers Leaders
Tableau Software Microsoft
QlikTech
Oracle IBM
SAS
MicroStrategy
Ability to execute Board International Actuate SAP
Tibco Spotfire
LogiXML
Information Builders
Birst
Prognoz
Bifam
Panorama Software
Alterys
Jaspersoft Salient Management Company
Pentaho
Targit GoodData
Arcplan
Niche players Visionaries
Completeness of vision
As of February 2013
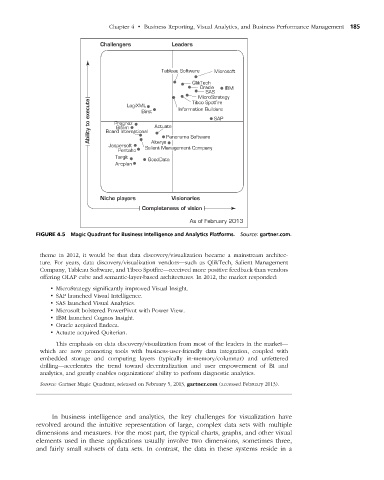
figuRe 4.5 Magic Quadrant for Business Intelligence and Analytics Platforms. Source: gartner.com.
theme in 2012, it would be that data discovery/visualization became a mainstream architec-
ture. For years, data discovery/visualization vendors—such as QlikTech, Salient Management
Company, Tableau Software, and Tibco Spotfire—received more positive feedback than vendors
offering OLAP cube and semantic-layer-based architectures. In 2012, the market responded:
• MicroStrategy significantly improved Visual Insight.
• SAP launched Visual Intelligence.
• SAS launched Visual Analytics.
• Microsoft bolstered PowerPivot with Power View.
• IBM launched Cognos Insight.
• Oracle acquired Endeca.
• Actuate acquired Quiterian.
This emphasis on data discovery/visualization from most of the leaders in the market—
which are now promoting tools with business-user-friendly data integration, coupled with
embedded storage and computing layers (typically in-memory/columnar) and unfettered
drilling—accelerates the trend toward decentralization and user empowerment of BI and
analytics, and greatly enables organizations’ ability to perform diagnostic analytics.
Source: Gartner Magic Quadrant, released on February 5, 2013, gartner.com (accessed February 2013).
In business intelligence and analytics, the key challenges for visualization have
revolved around the intuitive representation of large, complex data sets with multiple
dimensions and measures. For the most part, the typical charts, graphs, and other visual
elements used in these applications usually involve two dimensions, sometimes three,
and fairly small subsets of data sets. In contrast, the data in these systems reside in a
M04_SHAR9209_10_PIE_C04.indd 185 1/25/14 7:34 AM