
Page 189 -
P. 189
188 Part II • Descriptive Analytics
high-powered Visual Analytics environments
Due to the increasing demand for visual analytics coupled with fast-growing data volumes,
there is an exponential movement toward investing in highly efficient visualization systems.
With their latest move into visual analytics, the statistical software giant SAS Institute is
now among the ones who are leading this wave. Their new product, SAS Visual Analytics,
is a very high-performance, in-memory solution for exploring massive amounts of data
in a very short time (almost instantaneously). It empowers users to spot patterns, identify
opportunities for further analysis, and convey visual results via Web reports or a mobile
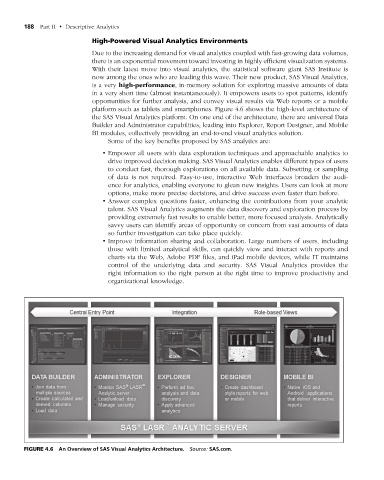
platform such as tablets and smartphones. Figure 4.6 shows the high-level architecture of
the SAS Visual Analytics platform. On one end of the architecture, there are universal Data
Builder and Administrator capabilities, leading into Explorer, Report Designer, and Mobile
BI modules, collectively providing an end-to-end visual analytics solution.
Some of the key benefits proposed by SAS analytics are:
• Empower all users with data exploration techniques and approachable analytics to
drive improved decision making. SAS Visual Analytics enables different types of users
to conduct fast, thorough explorations on all available data. Subsetting or sampling
of data is not required. Easy-to-use, interactive Web interfaces broaden the audi-
ence for analytics, enabling everyone to glean new insights. Users can look at more
options, make more precise decisions, and drive success even faster than before.
• Answer complex questions faster, enhancing the contributions from your analytic
talent. SAS Visual Analytics augments the data discovery and exploration process by
providing extremely fast results to enable better, more focused analysis. Analytically
savvy users can identify areas of opportunity or concern from vast amounts of data
so further investigation can take place quickly.
• Improve information sharing and collaboration. Large numbers of users, including
those with limited analytical skills, can quickly view and interact with reports and
charts via the Web, Adobe PDF files, and iPad mobile devices, while IT maintains
control of the underlying data and security. SAS Visual Analytics provides the
right information to the right person at the right time to improve productivity and
organizational knowledge.
figuRe 4.6 An Overview of SAS Visual Analytics Architecture. Source: SAS.com.
M04_SHAR9209_10_PIE_C04.indd 188 1/25/14 7:34 AM