
Page 28 - Calculus Demystified
P. 28
Basics
CHAPTER 1
Summary: We determine the equation of a line in the plane by finding two 15
expressions for the slope and equating them.
If a line has slope m and passes through the point (x 0 ,y 0 ) then it has equation
y − y 0 = m(x − x 0 ).
This is the point-slope form of a line.
If a line passes through the points (x 0 ,y 0 ) and (x 1 ,y 1 ) then it has equation
y − y 0 y 1 − y 0
= .
x − x 0 x 1 − x 0
This is the two-point form of a line.
You Try It: Find the line perpendicular to 2x + 5y = 10 that passes through
the point (1, 1). Now find the line that is parallel to the given line and passes
through (1, 1).
1.6 Loci in the Plane
The most interesting sets of points to graph are collections of points that are defined
by an equation. We call such a graph the locus of the equation. We cannot give all
the theory of loci here, but instead consider a few examples. See [SCH2] for more
on this matter.
EXAMPLE 1.13
2
Sketch the graph of {(x, y): y = x }.
SOLUTION
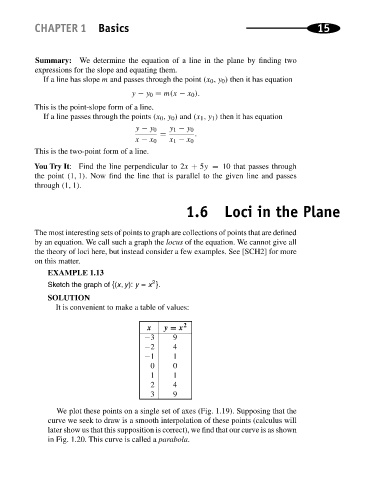
It is convenient to make a table of values:
2
x y = x
−3 9
−2 4
−1 1
0 0
1 1
2 4
3 9
We plot these points on a single set of axes (Fig. 1.19). Supposing that the
curve we seek to draw is a smooth interpolation of these points (calculus will
later show us that this supposition is correct), we find that our curve is as shown
in Fig. 1.20. This curve is called a parabola.