
Page 29 - Calculus Demystified
P. 29
16
y CHAPTER 1 Basics
x
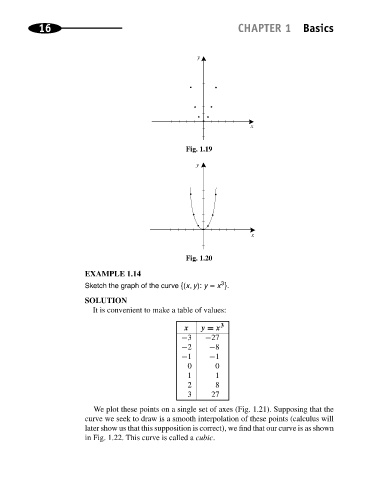
Fig. 1.19
Fig. 1.20
EXAMPLE 1.14
3
Sketch the graph of the curve {(x, y): y = x }.
SOLUTION
It is convenient to make a table of values:
3
x y = x
−3 −27
−2 −8
−1 −1
0 0
1 1
2 8
3 27
We plot these points on a single set of axes (Fig. 1.21). Supposing that the
curve we seek to draw is a smooth interpolation of these points (calculus will
later show us that this supposition is correct), we find that our curve is as shown
in Fig. 1.22. This curve is called a cubic.