
Page 31 - Calculus Demystified
P. 31
18 SOLUTION CHAPTER 1 Basics
It is convenient to make a table of values:
x y = x + x − 1
2
−4 11
−3 5
−2 1
−1 −1
0 −1
1 1
5
2 11
3
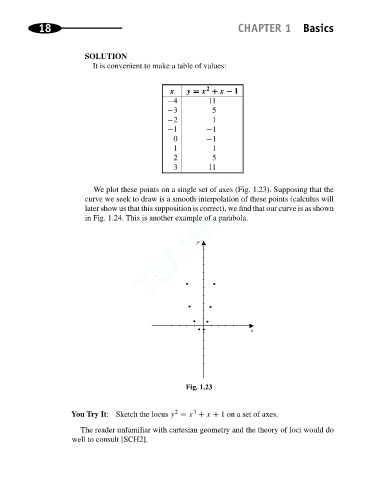
We plot these points on a single set of axes (Fig. 1.23). Supposing that the
curve we seek to draw is a smooth interpolation of these points (calculus will
later show us that this supposition is correct), we find that our curve is as shown
in Fig. 1.24. This is another example of a parabola.
TEAMFLY
y
x
Fig. 1.23
2 3
You Try It: Sketch the locus y = x + x + 1 on a set of axes.
The reader unfamiliar with cartesian geometry and the theory of loci would do
well to consult [SCH2].
Team-Fly
®