
Page 413 - Cam Design Handbook
P. 413
THB13 9/19/03 7:56 PM Page 401
CAM SYSTEM DYNAMICS—RESPONSE 401
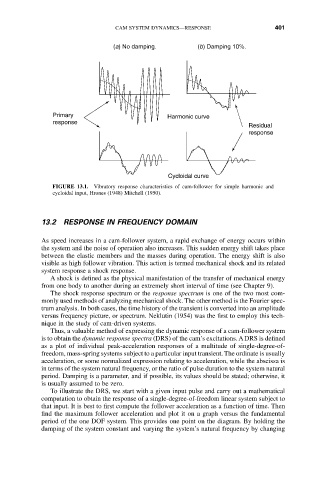
(a) No damping. (b) Damping 10%.
Primary Harmonic curve
response
Residual
response
Cycloidal curve
FIGURE 13.1. Vibratory response characteristics of cam-follower for simple harmonic and
cycloidal input, Hrones (1948) Mitchell (1950).
13.2 RESPONSE IN FREQUENCY DOMAIN
As speed increases in a cam-follower system, a rapid exchange of energy occurs within
the system and the noise of operation also increases. This sudden energy shift takes place
between the elastic members and the masses during operation. The energy shift is also
visible as high follower vibration. This action is termed mechanical shock and its related
system response a shock response.
A shock is defined as the physical manifestation of the transfer of mechanical energy
from one body to another during an extremely short interval of time (see Chapter 9).
The shock response spectrum or the response spectrum is one of the two most com-
monly used methods of analyzing mechanical shock. The other method is the Fourier spec-
trum analysis. In both cases, the time history of the transient is converted into an amplitude
versus frequency picture, or spectrum. Neklutin (1954) was the first to employ this tech-
nique in the study of cam-driven systems.
Thus, a valuable method of expressing the dynamic response of a cam-follower system
is to obtain the dynamic response spectra (DRS) of the cam’s excitations. A DRS is defined
as a plot of individual peak-acceleration responses of a multitude of single-degree-of-
freedom, mass-spring systems subject to a particular input transient. The ordinate is usually
acceleration, or some normalized expression relating to acceleration, while the abscissa is
in terms of the system natural frequency, or the ratio of pulse duration to the system natural
period. Damping is a parameter, and if possible, its values should be stated; otherwise, it
is usually assumed to be zero.
To illustrate the DRS, we start with a given input pulse and carry out a mathematical
computation to obtain the response of a single-degree-of-freedom linear system subject to
that input. It is best to first compute the follower acceleration as a function of time. Then
find the maximum follower acceleration and plot it on a graph versus the fundamental
period of the one DOF system. This provides one point on the diagram. By holding the
damping of the system constant and varying the system’s natural frequency by changing