
Page 152 - Carbonate Sedimentology and Sequence Stratigraphy
P. 152
CHAPTER 7: SEQUENCE STRATIGRAPHY OF THE T FACTORY 143
ble way, i.e. without “forcing” sequence boundaries the trends may not always correspond.
through conformable stacks of strata. ➤ Flat-topped carbonate platforms often require the
➤ Trends of shoaling and deepening (synoymous to trans- gradual-sequence approach because the lateral varia-
gressive and regressive in sequence terminology), are tion in accommodation is almost nil and lapout patterns
the essential building blocks for systems tracts under therefore extremely subtle and scarce. Bedding is essen-
these circumstances. tially parallel throughout.
➤ Criteria used for delineating shoaling/deepening ➤ Wherever possible, the platform record should be cor-
trends should be clearly indicated. In the sediment related with the deeper-water record beyond the plat-
record, water depth needs to be estimated via proxies form margin. Margins and slopes need to be searched
such as fair-weather wave base, depositional base level, for lowstand systems tracts because this is the most di-
base of the euphotic zone etc. Unlike hydrostatic pres- rect way of determining if major breaks are hidden in
sure, these proxies relate to depth in a relative way and the record of gradual change on the platform top.
A)
cumulative departure from mean bed (or cycle) thickness subsidence thickness of bed
bed (or cycle) number as estimate of time
B)
40
20
vertical scale (m) 0 relative time
20 mean subsidence vector
Mid-Ladinian
sequence
boundary
40
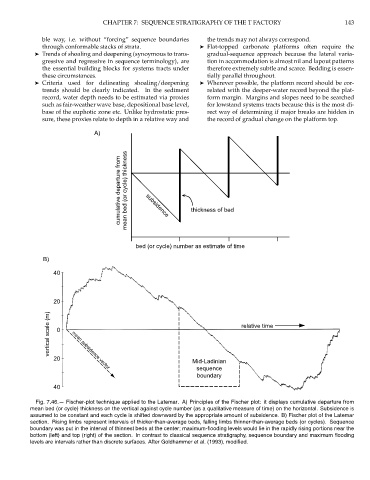
Fig. 7.46.— Fischer-plot technique applied to the Latemar. A) Principles of the Fischer plot: it displays cumulative departure from
mean bed (or cycle) thickness on the vertical against cycle number (as a qualitative measure of time) on the horizontal. Subsidence is
assumed to be constant and each cycle is shifted downward by the appropriate amount of subsidence. B) Fischer plot of the Latemar
section. Rising limbs represent intervals of thicker-than-average beds, falling limbs thinner-than-average beds (or cycles). Sequence
boundary was put in the interval of thinnest beds at the center; maximum-flooding levels would lie in the rapidly rising portions near the
bottom (left) and top (right) of the section. In contrast to classical sequence stratigraphy, sequence boundary and maximum flooding
levels are intervals rather than discrete surfaces. After Goldhammer et al. (1993), modified.