
Page 153 - Carbonate Sedimentology and Sequence Stratigraphy
P. 153
144 WOLFGANG SCHLAGER
Stratigraphic Column sea level - sedimentaion - In shoal-water carbonates, particularly of the T factory,
subsidence history
3.0 numerous studies have meticulously documented facies
white bands = and the nature of bedding surfaces, sometimes with a res-
time submerged olution of centimeters (Eggenhoff et al., 1999; Strasser et al.,
1999; D’Argenio et al., 1999; Homewood and Eberli, 2000;
Preto et al., 2001; Van Buchem et al., 2002; Della Porta 2003,
p. 212-222; Immenhauser et al., 2004) . The recurring pattern
is an alternation of deepening and shoaling trends, dissected
by surfaces indicating breaks in sedimentation. As thinner
and thinner beds are logged and correlated, the question
arises: What does it all mean? What is global or regional
signal, what is local “noise”in this fine web of beds, layers
3.0
and surfaces?
There are no hard and fast rules for interpreting the fine
detail of shoal-water carbonate sections in terms of deposi-
tional environments and stratigraphic sequences. However,
time (millions of years) time exposed
several rules of thumb have emerged from the studies of the
condensed black bands = past decades.
➤ Bounding surfaces. It is very important to distinguish
megacycle between: (1) exposure surfaces where marine deposi-
rhytmic tion was temporarily interrupted by terrestrial condi-
tions with at least incipient soil formation, and (2) flood-
megacycle
ing surfaces where a shoaling-upward trend peaked
3.0
in the shallow-marine, intertidal or supratidal environ-
ment, and the environment subsequently changed to
deeper or more open-marine conditions. The distinc-
tion is critical because flooding surfaces may be gen-
erated by internal feedback in the depositional system
whereas exposure surfaces require a drastic seaward
shift of the shoreline that is practically impossible with-
amalgamated
megacycle out a fall of relative sea level (chapter 6). Moreover, in-
cipient soils usually take 1 ky or more to develop (p.
10 m
sediment
surface 98-99); this yields a minimum duration of recognizable
0 exposure surfaces.
0 -25m +25m
sea level amplitude ➤ Estimate the depositional relief that existed within the
individual facies belts. Use direct observation of chan-
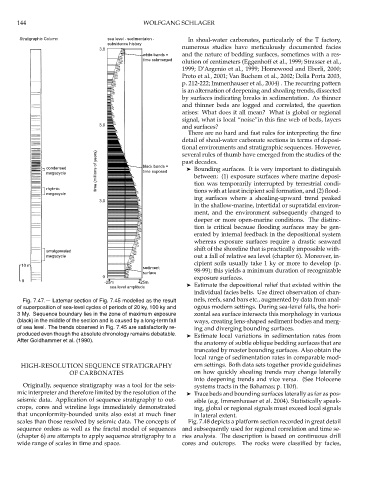
Fig. 7.47.— Latemar section of Fig. 7.45 modelled as the result nels, reefs, sand bars etc., augmented by data from anal-
of superposition of sea-level cycles of periods of 20 ky, 100 ky and ogous modern settings. During sea-level falls, the hori-
3 My. Sequence boundary lies in the zone of maximum exposure zontal sea surface intersects this morphology in various
(black) in the middle of the section and is caused by a long-term fall ways, creating lens-shaped sediment bodies and merg-
of sea level. The trends observed in Fig. 7.45 are satisfactorily re- ing and diverging bounding surfaces.
produced even though the absolute chronology remains debatable. ➤ Estimate local variations in sedimentation rates from
After Goldhammer et al. (1990).
the anatomy of subtle oblique bedding surfaces that are
truncated by master bounding surfaces. Also obtain the
local range of sedimentation rates in comparable mod-
HIGH-RESOLUTION SEQUENCE STRATIGRAPHY ern settings. Both data sets together provide guidelines
OF CARBONATES on how quickly shoaling trends may change laterally
into deepening trends and vice versa. (See Holocene
Originally, sequence stratigraphy was a tool for the seis- systems tracts in the Bahamas; p. 110f).
mic interpreter and therefore limited by the resolution of the ➤ Trace beds and bounding surfaces laterally as far as pos-
seismic data. Application of sequence stratigraphy to out- sible (e.g. Immenhauser et al. 2004). Statistically speak-
crops, cores and wireline logs immediately demonstrated ing, global or regional signals must exceed local signals
that unconformity-bounded units also exist at much finer in lateral extent.
scales than those resolved by seismic data. The concepts of Fig. 7.48 depicts a platform section recorded in great detail
sequence orders as well as the fractal model of sequences and subsequently used for regional correlation and time se-
(chapter 6) are attempts to apply sequence stratigraphy to a ries analysis. The description is based on continuous drill
wide range of scales in time and space. cores and outcrops. The rocks were classified by facies,