
Page 168 - Carbonate Sedimentology and Sequence Stratigraphy
P. 168
CHAPTER 9: LOOKING BACK, MOVING FORWARD 159
shoreface
4
Log metabolicrate (kcal/day) 2
prodelta foresets 3
rat female dog female dog male
1 dove rat male pigeon hen sheep woman man steer cow steer
continental slope
-1 0 1 2 3
mass (kg)
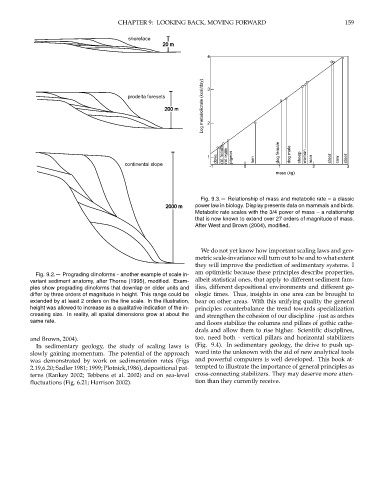
Fig. 9.3.— Relationship of mass and metabolic rate – a classic
power law in biology. Display presents data on mammals and birds.
Metabolic rate scales with the 3/4 power of mass – a relationship
that is now known to extend over 27 orders of magnitude of mass.
After West and Brown (2004), modified.
We do not yet know how important scaling laws and geo-
metric scale-invariance will turn out to be and to what extent
they will improve the prediction of sedimentary systems. I
am optimistic because these principles describe properties,
Fig. 9.2.— Prograding clinoforms - another example of scale in-
variant sediment anatomy, after Thorne (1995), modified. Exam- albeit statistical ones, that apply to different sediment fam-
ples show prograding clinoforms that downlap on older units and ilies, different depositional environments and different ge-
differ by three orders of magnitude in height. This range could be ologic times. Thus, insights in one area can be brought to
extended by at least 2 orders on the fine scale. In the illustration, bear on other areas. With this unifying quality the general
height was allowed to increase as a qualitative indication of the in- principles counterbalance the trend towards specialization
creasing size. In reality, all spatial dimensions grow at about the and strengthen the cohesion of our discipline - just as arches
same rate.
and floors stabilize the columns and pillars of gothic cathe-
drals and allow them to rise higher. Scientific disciplines,
and Brown, 2004). too, need both - vertical pillars and horizontal stabilizers
In sedimentary geology, the study of scaling laws is (Fig. 9.4). In sedimentary geology, the drive to push up-
slowly gaining momentum. The potential of the approach ward into the unknown with the aid of new analytical tools
was demonstrated by work on sedimentation rates (Figs and powerful computers is well developed. This book at-
2.19,6.20; Sadler 1981; 1999; Plotnick,1986), depositional pat- tempted to illustrate the importance of general principles as
terns (Rankey 2002; Tebbens et al. 2002) and on sea-level cross-connecting stabilizers. They may deserve more atten-
fluctuations (Fig. 6.21; Harrison 2002). tion than they currently receive.