Page 173 - Carbonate Sedimentology and Sequence Stratigraphy
P. 173

164                                      WOLFGANG SCHLAGER


                    4
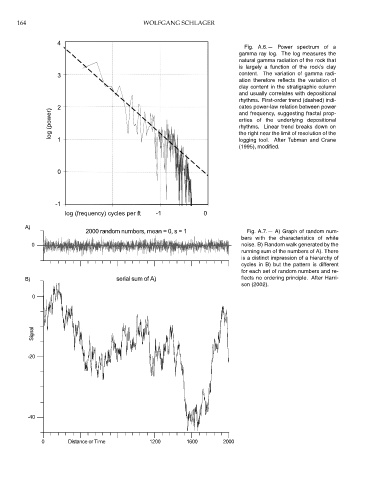
                                                                                  Fig. A.6.— Power spectrum of a
                                                                                gamma ray log. The log measures the
                                                                                natural gamma radiation of the rock that
                                                                                is largely a function of the rock’s clay
                    3                                                           content. The variation of gamma radi-
                                                                                ation therefore reflects the variation of
                                                                                clay content in the stratigraphic column
                                                                                and usually correlates with depositional
                                                                                rhythms. First-order trend (dashed) indi-
                    2                                                           cates power-law relation between power
                  log (power)                                                   erties of the underlying depositional
                                                                                and frequency, suggesting fractal prop-
                                                                                rhythms. Linear trend breaks down on
                                                                                logging tool. After Tubman and Crane
                    1                                                           the right near the limit of resolution of the
                                                                                (1995), modified.


                    0


                   -1
                       log (frequency) cycles per ft  -1            0
         A)
                             2000 random numbers, mean = 0, s = 1                  Fig. A.7.— A) Graph of random num-
                                                                                 bers with the characteristics of white
           0                                                                     noise. B) Random walk generated by the
                                                                                 running sum of the numbers of A). There
                                                                                 is a distinct impression of a hierarchy of
                                                                                 cycles in B) but the pattern is different
                                                                                 for each set of random numbers and re-
         B)                             serial sum of A)                         flects no ordering principle. After Harri-
                                                                                 son (2002).

            0


            Signal


          -20


          -40


               0        Distance or Time          1200         1600        2000
   168   169   170   171   172   173   174   175   176   177   178