
Page 178 - Carbonate Sedimentology and Sequence Stratigraphy
P. 178
APPENDIX B: INTRODUCTION TO MODELING PROGRAMS STRATA AND CARBONATE 3D 169
water depth, z, restriction, U 0 , and sediment load, L.As- A)
suming that the various stress factors act independently, the
stress function can be written as
S(z, L, U 0 )= D 0 (z) · U 0 (x, y) · L 0 (L)
with D 0 , U 0 and L 0 representing the stresses by water depth,
restriction and sediment load respectively. The functions D 0
and U 0 have been discussed under items 1 and 2 above. L 0
is explained in the context of sediment dispersal. It should
be noted that S = 0 indicates maximum stress, whereas S =1
indicates no stress and maximum production. P (x,y)
0
B)
Sediment dispersal
P 3 P 1
Sediment is dispersed by separately modeling sediment P 2
generation (volume and proportion of sand and mud), en-
trainment, transport and deposition. For the last three steps,
the total shear stress acting on the grains, τ total ,is calculated
as the sum of stresses from currents, waves and topographic
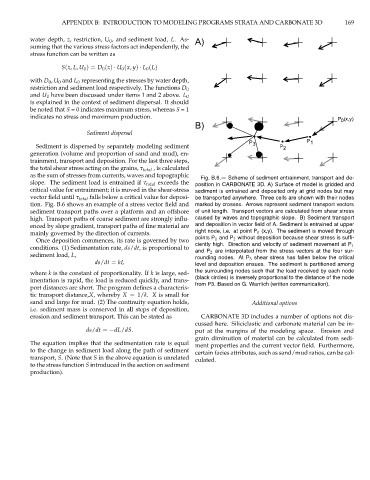
Fig. B.6.— Scheme of sediment entrainment, transport and de-
slope. The sediment load is entrained if τ total exceeds the position in CARBONATE 3D. A) Surface of model is gridded and
critical value for entrainment; it is moved in the shear-stress sediment is entrained and deposited only at grid nodes but may
vector field until τ total falls below a critical value for deposi- be transported anywhere. Three cells are shown with their nodes
tion. Fig. B.6 shows an example of a stress vector field and marked by crosses. Arrows represent sediment transport vectors
sediment transport paths over a platform and an offshore of unit length. Transport vectors are calculated from shear stress
high. Transport paths of coarse sediment are strongly influ- caused by waves and topographic slope. B) Sediment transport
enced by slope gradient, transport paths of fine material are and deposition in vector field of A. Sediment is entrained at upper
right node, i.e. at point P 0 (x,y). The sediment is moved through
mainly governed by the direction of currents.
points P 1 and P 2 without deposition because shear stress is suffi-
Once deposition commences, its rate is governed by two
ciently high. Direction and velocity of sediment movement at P 1
conditions. (1) Sedimentation rate, ds/dt,isproportionalto
and P 2 are interpolated from the stress vectors at the four sur-
sediment load, L,
rounding nodes. At P 3 shear stress has fallen below the critical
ds/dt = kL level and deposition ensues. The sediment is partitioned among
the surrounding nodes such that the load received by each node
where k is the constant of proportionality. If k is large, sed-
imentation is rapid, the load is reduced quickly, and trans- (black circles) is inversely proportional to the distance of the node
port distances are short. The program defines a characteris- from P3. Based on G. Warrlich (written communication).
tic transport distance,X,whereby X = 1/k. X is small for
sand and large for mud. (2) The continuity equation holds, Additional options
i.e. sediment mass is conserved in all steps of deposition,
erosion and sediment transport. This can be stated as CARBONATE 3D includes a number of options not dis-
cussed here. Siliciclastic and carbonate material can be in-
ds/dt = −dL/dS. put at the margins of the modeling space. Erosion and
grain diminution of material can be calculated from sedi-
The equation implies that the sedimentation rate is equal
ment properties and the current vector field. Furthermore,
to the change in sediment load along the path of sediment
certain facies attributes, such as sand/mud ratios, can be cal-
transport, S. (Note that S in the above equation is unrelated
culated.
to the stress function S introduced in the section on sediment
production).