
Page 177 - Carbonate Sedimentology and Sequence Stratigraphy
P. 177
168 WOLFGANG SCHLAGER
CARBONATE 3D restricted-marine type as a function of water depth and dis-
tance from the shelf break (Fig. B.5).
Overview
2) Restricted marine production is perceived as produc-
The program was mainly designed for creating detailed tion by predominantly algae that can tolerate restriction but
models of outcrops or specific objects in the subsurface, such require protection from high water energy. Consequently,
as hydrocarbon-bearing carbonate rocks and their surround- water energy is modeled as a stress on this biota. Water
ings. Consequently, CARBONATE 3D differs significantly energy, in turn, is assumed to decrease with distance from
from STRATA whose main objective is to model first-order the platform margin. The substitution of open-marine by re-
trends in the anatomy of sedimentary basin fills. stricted production and vice versa is shown in Fig. B.5. This
The program is genuinely three-dimensional. Space is approach is rather unusual and the assumed co-variance of
divided into cells and calculations regulate the transfer of restriction and protection in depositional environments is
mass and energy between each cell and its neighbors. at variance with observations at extant platforms (e.g. Fig.
2.12). From a computational point of view, however, the
most important thing is that the program makes it possible
Carbonate production
to change total production, i.e. the sum of open-marine and
The program is very flexible in modeling carbonate pro- restricted production, as a function of restriction.
duction. To start with, three production types are distin- 3) Pelagic production is the material of carbonate plank-
guished: shallow, open-marine; shallow, restricted marine; ton that lives in the top few hundred meters of the water col-
and pelagic production. For each type, an optimal produc- umn. The program models plankton production as a func-
tion rate can be specified and then reduced as desirable, de- tion of the thickness of the water column (Fig. B.4). Plankton
pending on local environmental stress. production is zero at sea level (i.e. a water column of zero)
1) The shallow, open-marine production type has a and increases exponentially with depth, asymptotically ap-
growth function similar to the T factory (chapter 2). Im- proaching the optimal pelagic production rate. The ratio-
portant stress can be generated by water depth, high rates nale is that in environments with very shallow sea floors
of sedimentation and high sediment load in the water. Lin- the shallow-water (benthic) production overshadows plank-
ear increase of any of these factors leads to exponential de- tonic production. The balance shifts as benthic growth slows
crease of production. The exponential decay with depth down with increasing depth and decreasing light.
starts below a zone of optimal production (Fig. B.4). The Production rate is calculated separately for each produc-
function is very similar to the open-ocean production func- tion type. The shallow, open-marine type may serve as an
tion of STRATA. Stress by restriction is modeled as progres- example. Production rate as a function of the horizontal co-
sive replacement of the open-marine production type by the ordinates, P(x, y), is expressed as
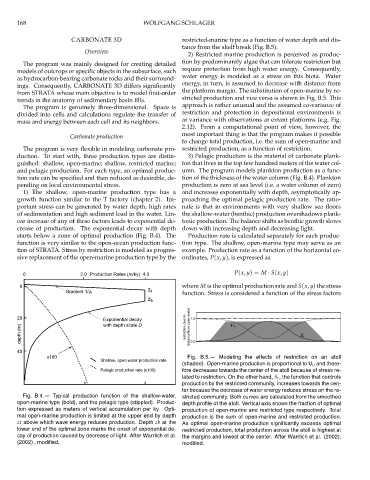
0 2.0 Production Rates (m/ky) 4.0 P(x, y)= M · S(x, y)
0 where M is the optimal production rate and S(x, y) the stress
z t
Gradient 1/z t function. Stress is considered a function of the stress factors
z b
restriction due to distancefrom open water S r
20 Exponential decay 1.0
with depth scale D U o
40 0.0
x100 Fig. B.5.— Modeling the effects of restriction on an atoll
Shallow, open water production rate
(shaded). Open-marine production is proportional to U 0 and there-
Pelagic production rate (x100) fore decreases towards the center of the atoll because of stress re-
lated to restriction. On the other hand, S r , the function that controls
production by the restricted community, increases towards the cen-
ter because the decrease of water energy reduces stress on the re-
Fig. B.4.— Typical production function of the shallow-water, stricted community. Both curves are calculated from the smoothed
open-marine type (bold), and the pelagic type (stippled). Produc- depth profile of the atoll. Vertical axis shows the fraction of optimal
tion expressed as meters of vertical accumulation per ky. Opti- production of open-marine and restricted type respectively. Total
mal open-marine production is limited at the upper end by depth production is the sum of open-marine and restricted production.
zt above which wave energy reduces production. Depth zb at the As optimal open-marine production significantly exceeds optimal
lower end of the optimal zone marks the onset of exponential de- restricted production, total production across the atoll is highest at
cay of production caused by decrease of light. After Warrlich et al. the margins and lowest at the center. After Warrlich et al. (2002),
(2002) , modified. modified.