
Page 182 - Carbonate Sedimentology and Sequence Stratigraphy
P. 182
APPENDIX C: PRINCIPLES OF REFLECTION SEISMOLOGY 173
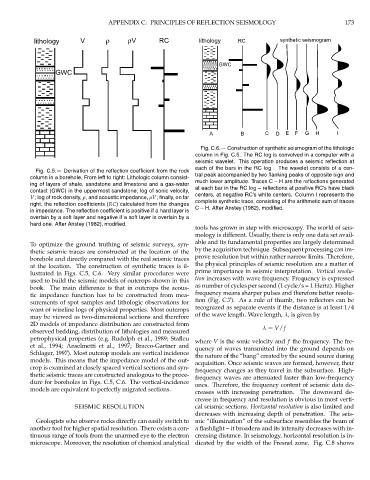
lithology V ρ ρV RC lithology RC synthetic seismogram
GWC
GWC
A B C D E F G H I
Fig. C.6.— Construction of synthetic seismogram of the lithologic
column in Fig. C.5. The RC log is convolved in a computer with a
seismic wavelet. This operation produces a seismic reflection at
each of the bars in the RC log . The wavelet consists of a cen-
Fig. C.5.— Derivation of the reflection coefficient from the rock
column in a borehole. From left to right: Lithologic column consist- tral peak accompanied by two flanking peaks of opposite sign and
ing of layers of shale, sandstone and limestone and a gas-water much lower amplitude. Traces C – H are the reflections generated
contact (GWC) in the uppermost sandstone; log of sonic velocity, at each bar in the RC log – reflections at positive RC’s have black
V; log of rock density, ρ, and acoustic impedance, ρV; finally, on far centers, at negative RC’s white centers. Column I represents the
right, the reflection coefficients (RC) calculated from the changes complete synthetic trace, consisting of the arithmetic sum of traces
in impedance. The reflection coefficient is positive if a hard layer is C – H. After Anstey (1982), modified.
overlain by a soft layer and negative if a soft layer is overlain by a
hard one. After Anstey (1982), modified.
tools has grown in step with microscopy. The world of seis-
mology is different. Usually, there is only one data set avail-
To optimize the ground truthing of seismic surveys, syn- able and its fundamental properties are largely determined
thetic seismic traces are constructed at the location of the by the acquisition technique. Subsequent processing can im-
borehole and directly compared with the real seismic traces prove resolution but within rather narrow limits. Therefore,
at the location. The construction of synthetic traces is il- the physical principles of seismic resolution are a matter of
lustrated in Figs. C.5, C.6. Very similar procedures were prime importance in seismic interpretation. Vertical resolu-
tion increases with wave frequency. Frequency is expressed
used to build the seismic models of outcrops shown in this
as number of cycles per second (1 cycle/s = 1 Hertz). Higher
book. The main difference is that in outcrops the acous-
frequency means sharper pulses and therefore better resolu-
tic impedance function has to be constructed from mea-
tion (Fig. C.7). As a rule of thumb, two reflectors can be
surements of spot samples and lithologic observations for
recognized as separate events if the distance is at least 1/4
want of wireline logs of physical properties. Most outcrops
of the wave length. Wave length, λ, is given by
may be viewed as two-dimensional sections and therefore
2D models of impedance distribution are constructed from
λ = V/ f
observed bedding, distribution of lithologies and measured
petrophysical properties (e.g. Rudolph et al., 1989; Stafleu where V is the sonic velocity and f the frequency. The fre-
et al., 1994; Anselmetti et al., 1997; Bracco-Gartner and quency of waves transmitted into the ground depends on
Schlager, 1997). Most outcrop models are vertical incidence the nature of the “bang” created by the sound source during
models. This means that the impedance model of the out- acquisition. Once seismic waves are formed, however, their
crop is examined at closely spaced vertical sections and syn- frequency changes as they travel in the subsurface. High-
thetic seismic traces are constructed analogous to the proce- frequency waves are attenuated faster than low-frequency
dure for boreholes in Figs. C.5, C.6. The vertical-incidence ones. Therefore, the frequency content of seismic data de-
models are equivalent to perfectly migrated sections.
creases with increasing penetration. The downward de-
crease in frequency and resolution is obvious in most verti-
SEISMIC RESOLUTION cal seismic sections. Horizontal resolution is also limited and
decreases with increasing depth of penetration. The seis-
Geologists who observe rocks directly can easily switch to mic “illumination” of the subsurface resembles the beam of
another tool for higher spatial resolution. There exists a con- a flashlight – it broadens and its intensity decreases with in-
tinuous range of tools from the unarmed eye to the electron creasing distance. In seismology, horizontal resolution is in-
microscope. Moreover, the resolution of chemical analytical dicated by the width of the Fresnel zone. Fig. C.8 shows