
Page 86 - Carbonate Sedimentology and Sequence Stratigraphy
P. 86
CHAPTER 5: RHYTHMS AND EVENTS IN CARBONATE STRATIGRAPHY 77
Fig. 5.6.— Bundling of beds into sets of 4 or 5 is often a first
indication of their orbital origin if their estimate duration is in the
4
5
range of 10 to 10 y. Example is from the Dachstein Fm., Late
Triassic, Northern Calcareous Alps. After Fischer (1964).
ETP
composite
-4 -2 0 2 4 6
405 128 97 54 41 29 24 22 19 (period in ka) 10
180
9
1200 1000 800 600 400 200 0
color-scale for power
160
1500 8
spectrum 142
140 1000 mpts= 800ka
7
500 0 0 0.02 0.04 0.06 0.08 6
number of power spectra 100 1500 spectrum 068 5 Ma before present
120
1000
80
500
4
0
0.04
0
0.02
0.08
0.06
60
3
40 1500
spectrum 001 2
1000
20
500
1
0
0 0.02 0.04 0.06 0.08
0
0
0 0.01 0.02 0.03 0.04 0.05 0.06 0.07 0..08 0
frequency (cycles / ka)
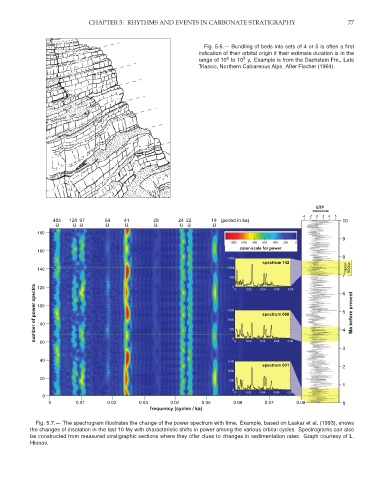
Fig. 5.7.— The spectrogram illustrates the change of the power spectrum with time. Example, based on Laskar et al. (1993), shows
the changes of insolation in the last 10 My with characteristic shifts in power among the various orbital cycles. Spectrograms can also
be constructed from measured stratigraphic sections where they offer clues to changes in sedimentation rates. Graph courtesy of L.
Hinnov.