
Page 91 - Carbonate Sedimentology and Sequence Stratigraphy
P. 91
82 WOLFGANG SCHLAGER
C O S D C P T J K TT
400
A)
300
100
Triassic
80 Reconstructed no. of reef sites
Permian 200
60
40
100
20
0
0
500 400 300 200 100 0
60
Late Permian
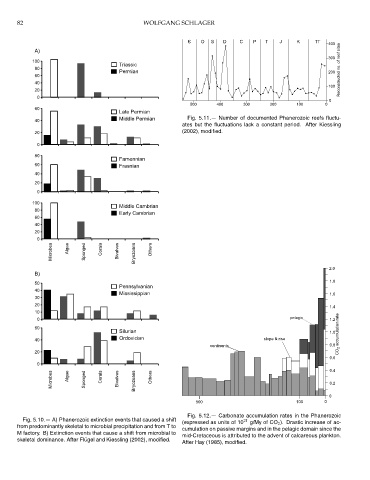
40 Middle Permian Fig. 5.11.— Number of documented Phanerozoic reefs fluctu-
ates but the fluctuations lack a constant period. After Kiessling
(2002), modified.
20
0
80
Famennian
60 Frasnian
40
20
0
100
Middle Cambrian
80
Early Cambrian
60
40
20
0
Microbes Algae Sponged Corals Bivalves Bryozoans Others
2.0
B)
1.8
50
Pennsylvanian
40
Mississippian 1.6
30
20
1.4
10
0 pelagic 1.2
60
Silurian 0.8 accumulation rate
1.0
40 Ordovician slope & rise
continents
20 CO 2
0.6
0 0.4
Microbes Algae Sponged Corals Bivalves Bryozoans Others 0.2
0
500 100 0
Fig. 5.12.— Carbonate accumulation rates in the Phanerozoic
Fig. 5.10.— A) Phanerozoic extinction events that caused a shift (expressed as units of 10 21 g/My of CO 2 ). Drastic increase of ac-
from predominantly skeletal to microbial precipitation and from T to cumulation on passive margins and in the pelagic domain since the
M factory. B) Extinction events that cause a shift from microbial to mid-Cretaceous is attributed to the advent of calcareous plankton.
skeletal dominance. After Flügel and Kiessling (2002), modified.
After Hay (1985), modified.