Page 87 - Carbonate Sedimentology and Sequence Stratigraphy
P. 87

78                                       WOLFGANG SCHLAGER


       A)                    B)
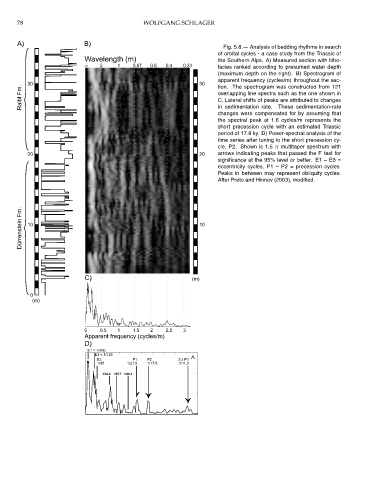
                                                                           Fig. 5.8.— Analysis of bedding rhythms in search
                                                                         of orbital cycles - a case study from the Triassic of
                                                                         the Southern Alps. A) Measured section with litho-
                                                                         facies ranked according to presumed water depth
                                                                         (maximum depth on the right). B) Spectrogram of
                                                                         apparent frequency (cycles/m) throughout the sec-
                                                                         tion. The spectrogram was constructed from 121
                                                                         overlapping line spectra such as the one shown in
                                                                         C. Lateral shifts of peaks are attributed to changes
                                                                         in sedimentation rate.  These sedimentation-rate
                                                                         changes were compensated for by assuming that
                                                                         the spectral peak at 1.6 cycles/m represents the
                                                                         short precession cycle with an estimated Triassic
                                                                         period of 17.8 ky. D) Power-spectral analysis of the
                                                                         time series after tuning to the short precession cy-
                                                                         cle, P2. Shown is 1.5 π multitaper spectrum with
                                                                         arrows indicating peaks that passed the F test for
                                                                         significance at the 95% level or better. E1 – E3 =
                                                                         eccentricity cycles, P1 – P2 = precession cycles.
                                                                         Peaks in between may represent obliquity cycles.
                                                                         After Preto and Hinnov (2003), modified.


                             C)


                             D)
   82   83   84   85   86   87   88   89   90   91   92