
Page 287 - Carrahers_Polymer_Chemistry,_Eighth_Edition
P. 287
250 Carraher’s Polymer Chemistry
High T material Low T material
g
g
Viscosity Viscosity Viscosity
Desired
temperature
range
T g T g RT T g RT
(a) Temperature (b) (c)
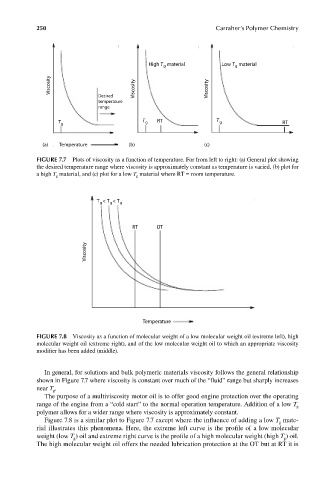
FIGURE 7.7 Plots of viscosity as a function of temperature. For from left to right: (a) General plot showing
the desired temperature range where viscosity is approximately constant as temperature is varied, (b) plot for
a high T g material, and (c) plot for a low T g material where RT = room temperature.
T < T < T
g g g
RT OT
Viscosity
Temperature
FIGURE 7.8 Viscosity as a function of molecular weight of a low molecular weight oil (extreme left), high
molecular weight oil (extreme right), and of the low molecular weight oil to which an appropriate viscosity
modifier has been added (middle).
In general, for solutions and bulk polymeric materials viscosity follows the general relationship
shown in Figure 7.7 where viscosity is constant over much of the “fluid” range but sharply increases
near T .
g
The purpose of a multiviscosity motor oil is to offer good engine protection over the operating
range of the engine from a “cold start” to the normal operation temperature. Addition of a low T
g
polymer allows for a wider range where viscosity is approximately constant.
Figure 7.8 is a similar plot to Figure 7.7 except where the infl uence of adding a low T mate-
g
rial illustrates this phenomena. Here, the extreme left curve is the profile of a low molecular
weight (low T ) oil and extreme right curve is the profile of a high molecular weight (high T ) oil.
g
g
The high molecular weight oil offers the needed lubrication protection at the OT but at RT it is
9/14/2010 3:40:05 PM
K10478.indb 250
K10478.indb 250 9/14/2010 3:40:05 PM