
Page 72 - Carrahers_Polymer_Chemistry,_Eighth_Edition
P. 72
Polymer Structure (Morphology) 35
portion. This temperature is often referred to as the crystalline transition temperature, T . This tem-
c
perature is directly related to the melt transition temperature, T or melting point. Finally, as the tem-
m
perature continues to rise there is sufficient energy available to overcome the primary bonds holding
the polymer together and the polymer decomposes at the decomposition temperature, T . The T and
d g
T are described further below.
m
The flexibility of amorphous polymers is reduced drastically when they are cooled below a charac-
teristic transition temperature called the glass transition temperature (T ). At temperatures below T
g g
there is no ready segmental motion, and any dimensional change in the polymer chain is the result of
temporary distortions of the primary covalent bonds. Amorphous plastics perform best below T but
g
elastomers must be used above the brittle point, T , or they will act as a glass and be brittle and break
g
when bent. The importance of a material being above its T to offer some flexibility was demonstrated
g
by the space shuttle Challenger disaster where the cool temperature at the launch pad resulted in the
“O” ring not being flexible so that fuel escaped resulting in the subsequent explosion.
The melting point (also called the melt transition temperature) is the temperature range where
total or whole polymer chain mobility occurs. The melting point (T ) is called a fi rst-order transi-
m
tion temperature, and T is sometimes referred to as a second-order transition. The values for T
g m
are usually 33%–100% greater than the T . Symmetrical polymers like HDPE exhibit the greatest
g
difference between T and T . The T values are low for elastomers and flexible polymers, such as
m g g
PE and dimethylsiloxane, are relatively high for hard amorphous plastics, such as polyacrylonitrile
and PET (Table 2.3).
o
The T for isotactic PP is 373 K or 100 C, yet, because of its high degree of crystallinity, it does
g
o
not flow to any great extent below its melting point of 438 K (165 C). In contrast, the highly amor-
o
phous polyisobutylene, which has a T value of 203 K (−70 C), flows at room temperature (Table 2.3).
g
T decreases as the size of the ester groups increases in polyacrylates and polymethylacrylates. The
g
effect of the phenylene stiffening groups is also demonstrated with the T of PET (2.12) being about
g
o
120 higher than that of poly(ethylene adipate) (2.13).
The main reasons why amorphous polymers go from a solid glassy state to a more fl exible plastic
state are the presence of sufficient energy and unoccupied volume. The energy is supplied by heating
the sample and allows the polymer sufficient energy for the chain segments to become separated and
to begin movement, which in turn creates free or unoccupied volume that allows the chain segments
to slip past one another, resulting in the material being more flexible. For the chains to begin moving,
the secondary forces that hold the chains together must be overcome. As movement begins, addi-
tional unoccupied volume is created and this expansion within a complex maze of intertwining chains
creates additional free volume. A measure of this expansion is the thermal coeffi cient of expansion.
The temperature range where the available free volume and energy necessary to overcome segmental
chain interactions is available is called the glass transition temperature, T . Since the specifi c volume
g
of polymers increases at T to accommodate the increased segmental chain motion, T values can be
g g
estimated from plots of the change in specific volume with temperature (Figure 2.10).
Below the T , the chains are “frozen” into place and the material acts as a brittle solid or glass,
g
hence the name glassy state.
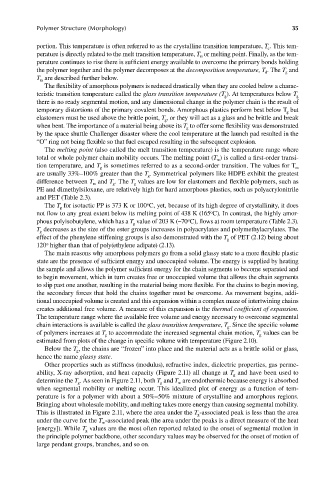
Other properties such as stiffness (modulus), refractive index, dielectric properties, gas perme-
ability, X-ray adsorption, and heat capacity (Figure 2.11) all change at T and have been used to
g
determine the T . As seen in Figure 2.11, both T and T are endothermic because energy is absorbed
g g m
when segmental mobility or melting occur. This idealized plot of energy as a function of tem-
perature is for a polymer with about a 50%–50% mixture of crystalline and amorphous regions.
Bringing about wholesale mobility, and melting takes more energy than causing segmental mobility.
This is illustrated in Figure 2.11, where the area under the T -associated peak is less than the area
g
under the curve for the T -associated peak (the area under the peaks is a direct measure of the heat
m
[energy]). While T values are the most often reported related to the onset of segmental motion in
g
the principle polymer backbone, other secondary values may be observed for the onset of motion of
large pendant groups, branches, and so on.
9/14/2010 3:35:57 PM
K10478.indb 35 9/14/2010 3:35:57 PM
K10478.indb 35