
Page 191 - Chalcogenide Glasses for Infrared Optics
P. 191
Glass Pr ocesses for Other Applications 167
20 mil Clad C1, 15 mil Clad C2
100
20 mil C1
90 30 mil C2, 15 mil C2
30 mil Clad C1
% Transmission relative to straight 70
80
60
50
40
30
20
10 30 mil C1
0
0 0.5 1.0
1/Radius (in)
54 3 2 1
Radius (in)
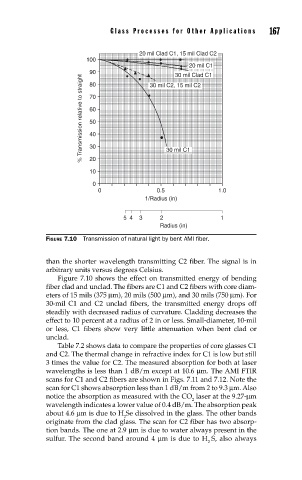
FIGURE 7.10 Transmission of natural light by bent AMI fi ber.
than the shorter wavelength transmitting C2 fiber. The signal is in
arbitrary units versus degrees Celsius.
Figure 7.10 shows the effect on transmitted energy of bending
fiber clad and unclad. The fibers are C1 and C2 fibers with core diam-
eters of 15 mils (375 µm), 20 mils (500 µm), and 30 mils (750 µm). For
30-mil C1 and C2 unclad fibers, the transmitted energy drops off
steadily with decreased radius of curvature. Cladding decreases the
effect to 10 percent at a radius of 2 in or less. Small-diameter, 10-mil
or less, C1 fibers show very little attenuation when bent clad or
unclad.
Table 7.2 shows data to compare the properties of core glasses C1
and C2. The thermal change in refractive index for C1 is low but still
3 times the value for C2. The measured absorption for both at laser
wavelengths is less than 1 dB/m except at 10.6 µm. The AMI FTIR
scans for C1 and C2 fibers are shown in Figs. 7.11 and 7.12. Note the
scan for C1 shows absorption less than 1 dB/m from 2 to 9.3 µm. Also
notice the absorption as measured with the CO laser at the 9.27-µm
2
wavelength indicates a lower value of 0.4 dB/m. The absorption peak
about 4.6 µm is due to H Se dissolved in the glass. The other bands
2
originate from the clad glass. The scan for C2 fiber has two absorp-
tion bands. The one at 2.9 µm is due to water always present in the
sulfur. The second band around 4 µm is due to H S, also always
2