
Page 206 - Chalcogenide Glasses for Infrared Optics
P. 206
182 Cha pte r Ei g h t
we had already learned, it is very difficult to make chalcogenide glass
rods that are homogeneous. The ribbon stacking method is well
suited for the chalcogenide glass fibers, particularly considering the
AMI method of drawing fibers.
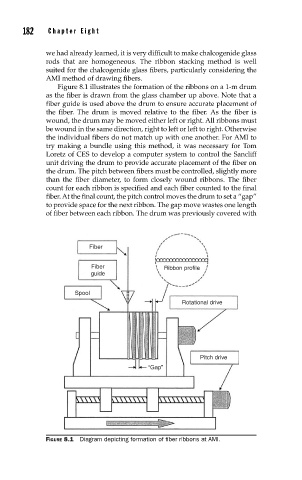
Figure 8.1 illustrates the formation of the ribbons on a 1-m drum
as the fiber is drawn from the glass chamber up above. Note that a
fiber guide is used above the drum to ensure accurate placement of
the fiber. The drum is moved relative to the fiber. As the fiber is
wound, the drum may be moved either left or right. All ribbons must
be wound in the same direction, right to left or left to right. Otherwise
the individual fibers do not match up with one another. For AMI to
try making a bundle using this method, it was necessary for Tom
Loretz of CES to develop a computer system to control the Sancliff
unit driving the drum to provide accurate placement of the fiber on
the drum. The pitch between fibers must be controlled, slightly more
than the fiber diameter, to form closely wound ribbons. The fiber
count for each ribbon is specified and each fiber counted to the final
fiber. At the final count, the pitch control moves the drum to set a “gap”
to provide space for the next ribbon. The gap move wastes one length
of fiber between each ribbon. The drum was previously covered with
Fiber
Fiber Ribbon profile
guide
Spool
Rotational drive
Pitch drive
“Gap”
FIGURE 8.1 Diagram depicting formation of fi ber ribbons at AMI.