
Page 211 - Chalcogenide Glasses for Infrared Optics
P. 211
IR Imaging Bundles Made fr om Chalcogenide Glass Fibers 187
using a microscope at 5X. The top image shows the cladding rings
around each fiber. Note the space between the fibers covered by the
cladding. The second image is made when visible light is transmitted
through the bundle. The image illustrates how much area is inactive
when you use clad fibers, at least when using the AMI method in
drawing fibers and making ribbons. The measured spacing between
the 100-µm fibers is 160 µm, thus limiting resolution by the bundle.
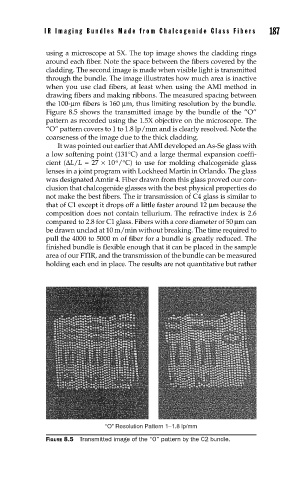
Figure 8.5 shows the transmitted image by the bundle of the “O”
pattern as recorded using the 1.5X objective on the microscope. The
“O” pattern covers to 1 to 1.8 lp/mm and is clearly resolved. Note the
coarseness of the image due to the thick cladding.
It was pointed out earlier that AMI developed an As-Se glass with
a low softening point (131°C) and a large thermal expansion coeffi-
-6
cient (∆L/L = 27 × 10 /°C) to use for molding chalcogenide glass
lenses in a joint program with Lockheed Martin in Orlando. The glass
was designated Amtir 4. Fiber drawn from this glass proved our con-
clusion that chalcogenide glasses with the best physical properties do
not make the best fibers. The ir transmission of C4 glass is similar to
that of C1 except it drops off a little faster around 12 µm because the
composition does not contain tellurium. The refractive index is 2.6
compared to 2.8 for C1 glass. Fibers with a core diameter of 50 µm can
be drawn unclad at 10 m/min without breaking. The time required to
pull the 4000 to 5000 m of fiber for a bundle is greatly reduced. The
finished bundle is flexible enough that it can be placed in the sample
area of our FTIR, and the transmission of the bundle can be measured
holding each end in place. The results are not quantitative but rather
“O” Resolution Pattern 1–1.8 lp/mm
FIGURE 8.5 Transmitted image of the “O” pattern by the C2 bundle.