
Page 24 - Chalcogenide Glasses for Infrared Optics
P. 24
Transmission of Light by Solids 3
refractive index change and physical properties superior to those of
germanium. However, silicon has a lattice absorption at 9 µm in the
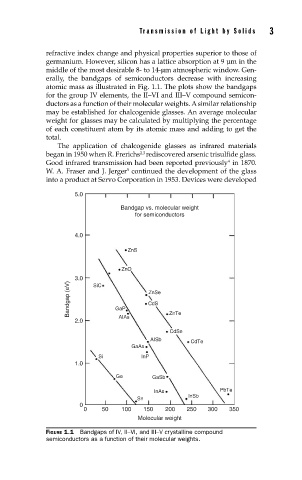
middle of the most desirable 8- to 14-µm atmospheric window. Gen-
erally, the bandgaps of semiconductors decrease with increasing
atomic mass as illustrated in Fig. 1.1. The plots show the bandgaps
for the group IV elements, the II–VI and III–V compound semicon-
ductors as a function of their molecular weights. A similar relationship
may be established for chalcogenide glasses. An average molecular
weight for glasses may be calculated by multiplying the percentage
of each constituent atom by its atomic mass and adding to get the
total.
The application of chalcogenide glasses as infrared materials
2,3
began in 1950 when R. Frerichs rediscovered arsenic trisulfide glass.
4
Good infrared transmission had been reported previously in 1870.
5
W. A. Fraser and J. Jerger continued the development of the glass
into a product at Servo Corporation in 1953. Devices were developed
5.0
Bandgap vs. molecular weight
for semiconductors
4.0
ZnS
ZnO
3.0 SiC
Bandgap (eV) GaP ZnSe
CdS
2.0 AIAs ZnTe
CdSe
AISb CdTe
GaAs
Si InP
1.0
Ge GaSb
InAs PbTe
InSb
Sn
0
0 50 100 150 200 250 300 350
Molecular weight
FIGURE 1.1 Bandgaps of IV, II–VI, and III–V crystalline compound
semiconductors as a function of their molecular weights.