
Page 29 - Chalcogenide Glasses for Infrared Optics
P. 29
8 Cha pte r O n e
have zero Pauling electronegativity differences, so their fundamental
lattice modes are not spectroscopically active. In both materials, weak
absorption by higher-order lattice vibration modes is observed.
An example of far infrared Reststrahlen-type reflection bands in
glasses is shown in Fig. 1.4. The infrared reflection for glassy quartz
is measured using the AMI Perkin Elmer FTIR spectrophotometer.
Note the very strong band at about 20 µm followed by another strong
band at 9 µm, about one-half the wavelength of the other. Note the
reflection peaks are 75 and 58 percent, really quite strong. Keep in
mind that the degree of ionic character in the silicon-oxygen bond is
considerable in comparison to those of the selenium-based covalent
glasses. The second band stops the infrared transmission of glassy
quartz, although it had already been stopped by the inpurity of water,
which absorbs strongly at 2.9 µm.
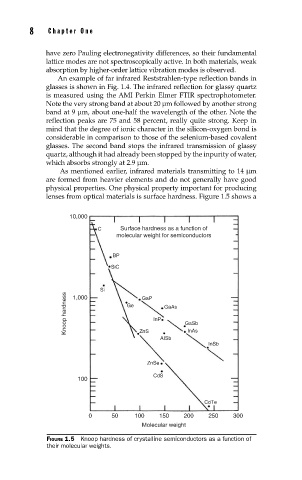
As mentioned earlier, infrared materials transmitting to 14 µm
are formed from heavier elements and do not generally have good
physical properties. One physical property important for producing
lenses from optical materials is surface hardness. Figure 1.5 shows a
10,000
C Surface hardness as a function of
molecular weight for semiconductors
BP
SiC
Si GaP
Knoop hardness Ge InP GaAs GaSb
1,000
ZnS
AISb InAs
InSb
ZnSe
CdS
100
CdTe
0 50 100 150 200 250 300
Molecular weight
FIGURE 1.5 Knoop hardness of crystalline semiconductors as a function of
their molecular weights.