
Page 275 - Chalcogenide Glasses for Infrared Optics
P. 275
250 Cha pte r T e n
5
Spitzer and Fan fall almost exactly on the TI measured values. These
measurements were made using the TI Perkin Elmer 301 grating
spectrophotometer, standard with a Golay cell detector or using the
TI liquid helium cooled, gallium doped germanium bolometer. A
study was run by TI and PE to compare the sensitivity of the Golay
6
cell to the TI bolometer that demonstrated the TI bolometer improved
S/N by a factor of 3. For every wavelength point, k values may be
calculated. In application of the scan technique, change in intensity of
the peaks is not the main concern. Only the wavelength location of
each peak is important.
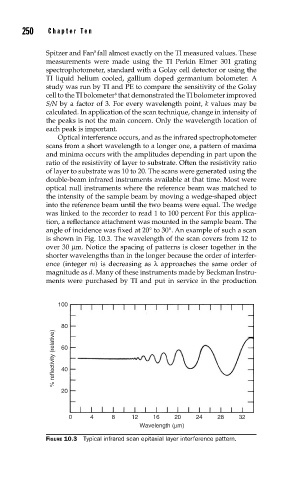
Optical interference occurs, and as the infrared spectrophotometer
scans from a short wavelength to a longer one, a pattern of maxima
and minima occurs with the amplitudes depending in part upon the
ratio of the resistivity of layer to substrate. Often the resistivity ratio
of layer to substrate was 10 to 20. The scans were generated using the
double-beam infrared instruments available at that time. Most were
optical null instruments where the reference beam was matched to
the intensity of the sample beam by moving a wedge-shaped object
into the reference beam until the two beams were equal. The wedge
was linked to the recorder to read 1 to 100 percent For this applica-
tion, a reflectance attachment was mounted in the sample beam. The
angle of incidence was fixed at 20° to 30°. An example of such a scan
is shown in Fig. 10.3. The wavelength of the scan covers from 12 to
over 30 µm. Notice the spacing of patterns is closer together in the
shorter wavelengths than in the longer because the order of interfer-
ence (integer m) is decreasing as λ approaches the same order of
magnitude as d. Many of these instruments made by Beckman Instru-
ments were purchased by TI and put in service in the production
100
80
% reflectivity (relative) 60
40
20
0 4 8 12 16 20 24 28 32
Wavelength (µm)
FIGURE 10.3 Typical infrared scan epitaxial layer interference pattern.