
Page 276 - Chalcogenide Glasses for Infrared Optics
P. 276
Early Work at Texas Instruments 251
area. Personnel were trained in operation and in calculating the results.
The simplified interpretation is that the wavelength locations of
maxima or minima are separated by 2π degrees. Using the wave-
lengths for adjacent maxima peaks, the general equation becomes
δ= 2n d cos θ = (λ – λ )
−1 −1
−1
1 1 2 1
−1
Or using cm to express wavelengths.
2n d cos θ = (ν – ν ) −1
1 1 1 2
In production areas, charts were made for the operator where all they
need to do is read the wavelengths of the peaks. To increase accuracy,
they may count a series of peaks and calculate an average wavelength
separation.
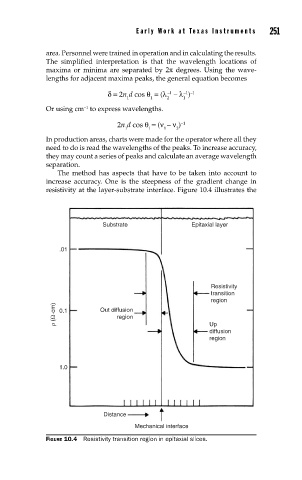
The method has aspects that have to be taken into account to
increase accuracy. One is the steepness of the gradient change in
resistivity at the layer-substrate interface. Figure 10.4 illustrates the
Substrate Epitaxial layer
.01
Resistivity
transition
region
ρ (Ω·cm) 0.1 Out diffusion
region
Up
diffusion
region
1.0
Distance
Mechanical interface
FIGURE 10.4 Resistivity transition region in epitaxial slices.