
Page 58 - Chalcogenide Glasses for Infrared Optics
P. 58
36 Cha pte r T w o
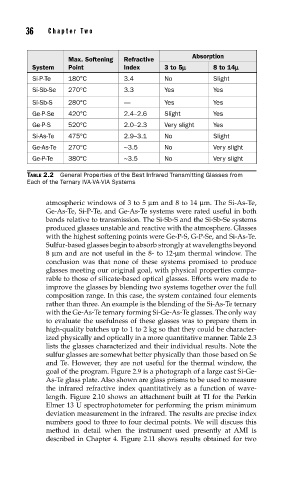
Absorption
Max. Softening Refractive
System Point Index 3 to 5m 8 to 14m
Si-P-Te 180°C 3.4 No Slight
Si-Sb-Se 270°C 3.3 Yes Yes
Si-Sb-S 280°C — Yes Yes
Ge-P-Se 420°C 2.4–2.6 Slight Yes
Ge-P-S 520°C 2.0–2.3 Very slight Yes
Si-As-Te 475°C 2.9–3.1 No Slight
Ge-As-Te 270°C ~3.5 No Very slight
Ge-P-Te 380°C ~3.5 No Very slight
TABLE 2.2 General Properties of the Best Infrared Transmitting Glasses from
Each of the Ternary IVA-VA-VIA Systems
atmospheric windows of 3 to 5 µm and 8 to 14 µm. The Si-As-Te,
Ge-As-Te, Si-P-Te, and Ge-As-Te systems were rated useful in both
bands relative to transmission. The Si-Sb-S and the Si-Sb-Se systems
produced glasses unstable and reactive with the atmosphere. Glasses
with the highest softening points were Ge-P-S, G-P-Se, and Si-As-Te.
Sulfur-based glasses begin to absorb strongly at wavelengths beyond
8 µm and are not useful in the 8- to 12-µm thermal window. The
conclusion was that none of these systems promised to produce
glasses meeting our original goal, with physical properties compa-
rable to those of silicate-based optical glasses. Efforts were made to
improve the glasses by blending two systems together over the full
composition range. In this case, the system contained four elements
rather than three. An example is the blending of the Si-As-Te ternary
with the Ge-As-Te ternary forming Si-Ge-As-Te glasses. The only way
to evaluate the usefulness of these glasses was to prepare them in
high-quality batches up to 1 to 2 kg so that they could be character-
ized physically and optically in a more quantitative manner. Table 2.3
lists the glasses characterized and their individual results. Note the
sulfur glasses are somewhat better physically than those based on Se
and Te. However, they are not useful for the thermal window, the
goal of the program. Figure 2.9 is a photograph of a large cast Si-Ge-
As-Te glass plate. Also shown are glass prisms to be used to measure
the infrared refractive index quantitatively as a function of wave-
length. Figure 2.10 shows an attachment built at TI for the Perkin
Elmer 13 U spectrophotometer for performing the prism minimum
deviation measurement in the infrared. The results are precise index
numbers good to three to four decimal points. We will discuss this
method in detail when the instrument used presently at AMI is
described in Chapter 4. Figure 2.11 shows results obtained for two