Page 60 - Chalcogenide Glasses for Infrared Optics
P. 60

38    Cha pte r  T w o


                                           Bridgeport rotary
                                               table
                                     M 4
                                           Slit S 1
                                    M 5
                                                                    M 2
                M 3
                                    Slit S 2
                 Off–axis                                 Spherical
                paraboloid     Detector                    mirror
                           M 6
                                              M 1

                                         Perkin–elmer 301 (or 13)
                                        infrared spectrophotometer
              FIGURE 2.10  Infrared refractometer attachment for the Perkin Elmer 13
              Spectrophotometer.


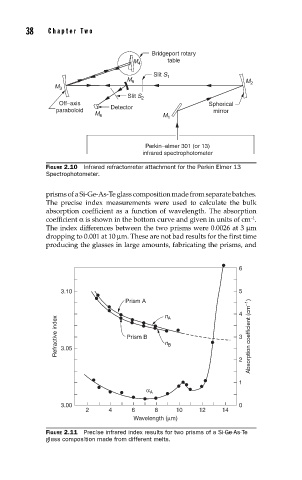
              prisms of a Si-Ge-As-Te glass composition made from separate batches.
              The precise index measurements were used to calculate the bulk
              absorption coefficient as a function of wavelength. The absorption
                                                                      –1
              coefficient α is shown in the bottom curve and given in units of cm .
              The index differences between the two prisms were 0.0026 at 3 µm
              dropping to 0.001 at 10 µm. These are not bad results for the first time
              producing the glasses in large amounts, fabricating the prisms, and


                                                                  6


                  3.10                                            5
                                   Prism A
                                                                  4
                 Refractive index   Prism B   n B                 3  Absorption coefficient (cm –1 )
                                              n A


                  3.05
                                                                  2


                                                                  1
                                         α A

                  3.00                                            0
                        2      4     6     8     10    12     14
                                      Wavelength (µm)
              FIGURE 2.11  Precise infrared index results for two prisms of a Si-Ge-As-Te
              glass composition made from different melts.
   55   56   57   58   59   60   61   62   63   64   65