
Page 64 - Chalcogenide Glasses for Infrared Optics
P. 64
42 Cha pte r T w o
500
400
Softening point (°C) 300
As 2 S 3
200
100
10 20 30 40
Thermal coefficient of expansion in (in · °C) × 10 6
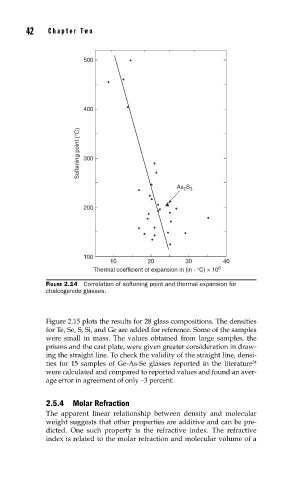
FIGURE 2.14 Correlation of softening point and thermal expansion for
chalcogenide glasses.
Figure 2.15 plots the results for 28 glass compositions. The densities
for Te, Se, S, Si, and Ge are added for reference. Some of the samples
were small in mass. The values obtained from large samples, the
prisms and the cast plate, were given greater consideration in draw-
ing the straight line. To check the validity of the straight line, densi-
ties for 15 samples of Ge-As-Se glasses reported in the literature
34
were calculated and compared to reported values and found an aver-
age error in agreement of only –3 percent.
2.5.4 Molar Refraction
The apparent linear relationship between density and molecular
weight suggests that other properties are additive and can be pre-
dicted. One such property is the refractive index. The refractive
index is related to the molar refraction and molecular volume of a