
Page 97 - Chalcogenide Glasses for Infrared Optics
P. 97
Glass Pr oduction 75
Germanium was considered to be the reactant of highest purity with
no particulate matter, so it was loaded in the center chamber, with sele-
nium on one side and arsenic or antimony on the other. All the materials
were heated slightly, and hydrogen flowed through the chambers with
the hope of reducing surface oxides. The next step was to seal the two
side tubes, evacuate the chambers, and seal off the top tube. Then sele-
nium on one side and arsenic or antimony on the other were heated and
distilled through the porous quartz filter (frit) to remove particulate mat-
ter. It is worth mentioning that the distillation of antimony was extremely
difficult and time-consuming. Antimony has only 10 mm of vapor pres-
sure at 1000°C. Particulate matter (C) was not present in the resulting
glass. The absorption in both glasses decreased relative to glass produced
using the production method current at the time. A definite correlation
for both glasses was found between increased silicon levels and absorp-
tion at 10.6 and 9.4 µm. The silica contamination, 2 to 5 ppm, probably
occurred during the quartz fabrication using the hydrogen oxygen torch.
The resulting oxygen concentration for both glasses, 5 ppm, was due to
silica and the 8 ppm in the reactant germanium. Addition of 5 ppm Al as
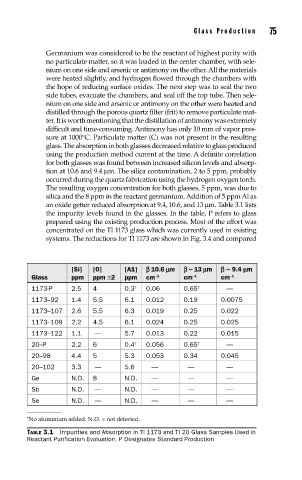
an oxide getter reduced absorption at 9.4, 10.6, and 13 µm. Table 3.1 lists
the impurity levels found in the glasses. In the table, P refers to glass
prepared using the existing production process. Most of the effort was
concentrated on the TI 1173 glass which was currently used in existing
systems. The reductions for TI 1173 are shown in Fig. 3.4 and compared
[Si] [0] [A1] b 10.6 mm b ~ 13 mm b ~ 9.4 mm
Glass ppm ppm ±2 ppm cm –1 cm −1 cm –1
1173-P 2.5 4 0.3 † 0.06 0.65 † —
1173–92 1.4 5.5 6.1 0.012 0.19 0.0075
1173–107 2.6 5.5 6.3 0.019 0.25 0.022
1173–109 2.2 4.5 6.1 0.024 0.25 0.025
1173–122 1.1 — 5.7 0.013 0.22 0.015
20–P 2.2 6 0.4 † 0.056 0.65 † —
20–98 4.4 5 5.3 0.053 0.34 0.045
20–102 3.3 — 5.6 — — —
Ge N.D. 8 N.D. — — —
Sb N.D. — N.D. — — —
Se N.D. — N.D. — — —
† No aluminium added. N.D. = not detected.
TABLE 3.1 Impurities and Absorption in TI 1173 and TI 20 Glass Samples Used in
Reactant Purification Evaluation. P Designates Standard Production