
Page 141 - Challenges in Corrosion Costs Causes Consequences and Control(2015)
P. 141
DATA COLLECTION AND ECONOMIC ANALYSIS 119
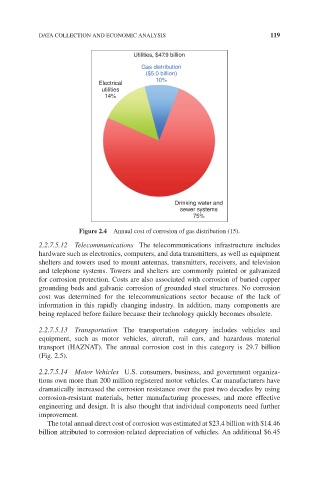
Utilities, $47.9 billion
Gas distribution
($5.0 billion)
10%
Electrical
utilities
14%
Drinking water and
sewer systems
75%
Figure 2.4 Annual cost of corrosion of gas distribution (15).
2.2.7.5.12 Telecommunications The telecommunications infrastructure includes
hardware such as electronics, computers, and data transmitters, as well as equipment
shelters and towers used to mount antennas, transmitters, receivers, and television
and telephone systems. Towers and shelters are commonly painted or galvanized
for corrosion protection. Costs are also associated with corrosion of buried copper
grounding beds and galvanic corrosion of grounded steel structures. No corrosion
cost was determined for the telecommunications sector because of the lack of
information in this rapidly changing industry. In addition, many components are
being replaced before failure because their technology quickly becomes obsolete.
2.2.7.5.13 Transportation The transportation category includes vehicles and
equipment, such as motor vehicles, aircraft, rail cars, and hazardous material
transport (HAZNAT). The annual corrosion cost in this category is 29.7 billion
(Fig. 2.5).
2.2.7.5.14 Motor Vehicles U.S. consumers, business, and government organiza-
tions own more than 200 million registered motor vehicles. Car manufacturers have
dramatically increased the corrosion resistance over the past two decades by using
corrosion-resistant materials, better manufacturing processes, and more effective
engineering and design. It is also thought that individual components need further
improvement.
The total annual direct cost of corrosion was estimated at $23.4 billion with $14.46
billion attributed to corrosion-related depreciation of vehicles. An additional $6.45