
Page 142 - Challenges in Corrosion Costs Causes Consequences and Control(2015)
P. 142
120 CORROSION COSTS
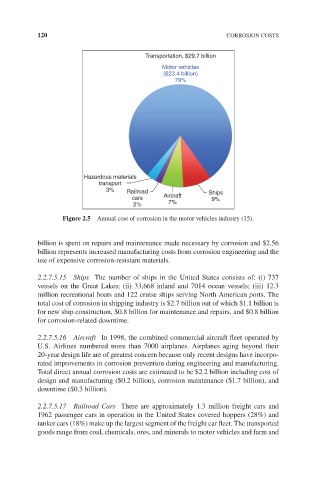
Transportation, $29.7 billion
Motor vehicles
($23.4 billion)
79%
Hazardous materials
transport
3% Railroad Ships
cars Aircraft 9%
2% 7%
Figure 2.5 Annual cost of corrosion in the motor vehicles industry (15).
billion is spent on repairs and maintenance made necessary by corrosion and $2.56
billion represents increased manufacturing costs from corrosion engineering and the
use of expensive corrosion-resistant materials.
2.2.7.5.15 Ships The number of ships in the United States consists of: (i) 737
vessels on the Great Lakes; (ii) 33,668 inland and 7014 ocean vessels; (iii) 12.3
million recreational boats and 122 cruise ships serving North American ports. The
total cost of corrosion in shipping industry is $2.7 billion out of which $1.1 billion is
for new ship construction, $0.8 billion for maintenance and repairs, and $0.8 billion
for corrosion-related downtime.
2.2.7.5.16 Aircraft In 1998, the combined commercial aircraft fleet operated by
U.S. Airlines numbered more than 7000 airplanes. Airplanes aging beyond their
20-year design life are of greatest concern because only recent designs have incorpo-
rated improvements in corrosion prevention during engineering and manufacturing.
Total direct annual corrosion costs are estimated to be $2.2 billion including cost of
design and manufacturing ($0.2 billion), corrosion maintenance ($1.7 billion), and
downtime ($0.3 billion).
2.2.7.5.17 Railroad Cars There are approximately 1.3 million freight cars and
1962 passenger cars in operation in the United States covered hoppers (28%) and
tanker cars (18%) make up the largest segment of the freight car fleet. The transported
goods range from coal, chemicals, ores, and minerals to motor vehicles and farm and