
Page 143 - Challenges in Corrosion Costs Causes Consequences and Control(2015)
P. 143
DATA COLLECTION AND ECONOMIC ANALYSIS 121
food products. Railroad cars suffer from both internal and external corrosion with a
total estimated corrosion cost of 0.5 billion. This estimated cost is divided equally
between the use of external coatings and internal coatings and linings.
2.2.7.5.18 Hazardous Materials Transport According to the U.S. Department of
Transportation, there are approximately 300 million hazardous material shipments
of more than 3.1 billion metric tons annually in the U.S. bulk transport over
land including shipping by tanker truck and rail car and by special containers on
vehicles. The total annual direct cost of corrosion for this sector is more than $0.9
billion that includes cost of transporting vehicles ($0.4 billion) and of specialized
packaging ($0.5 billion) as well as costs associated with accidental releases and
corrosion-related transportation incidents.
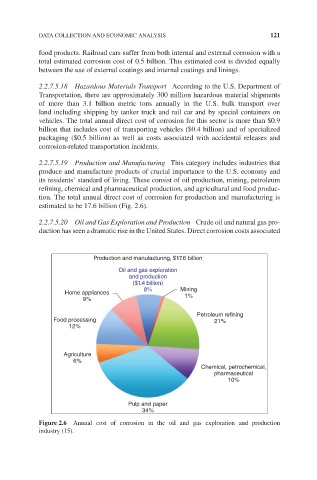
2.2.7.5.19 Production and Manufacturing This category includes industries that
produce and manufacture products of crucial importance to the U.S. economy and
its residents’ standard of living. These consist of oil production, mining, petroleum
refining, chemical and pharmaceutical production, and agricultural and food produc-
tion. The total annual direct cost of corrosion for production and manufacturing is
estimated to be 17.6 billion (Fig. 2.6).
2.2.7.5.20 Oil and Gas Exploration and Production Crude oil and natural gas pro-
duction has seen a dramatic rise in the United States. Direct corrosion costs associated
Production and manufacturing, $17.6 billion
Oil and gas exploration
and production
($1.4 billion)
8% Mining
Home appliances 1%
9%
Petroleum refining
Food processing 21%
12%
Agriculture
6%
Chemical, petrochemical,
pharmaceutical
10%
Pulp and paper
34%
Figure 2.6 Annual cost of corrosion in the oil and gas exploration and production
industry (15).