
Page 174 - Challenges in Corrosion Costs Causes Consequences and Control(2015)
P. 174
152 CORROSION CAUSES
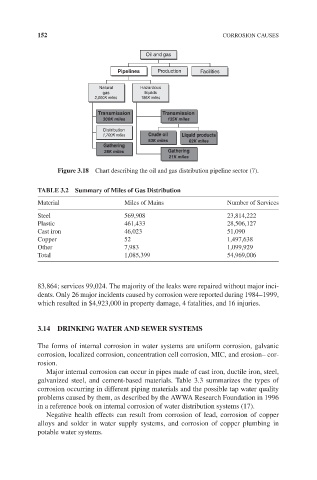
Oil and gas
Pipelines Production Facilities
Natural Hazardous
gas liquids
2,000K miles 156K miles
Transmission Transmission
300K miles 135K miles
Distribution
1,700K miles Crude oil Liquid products
53K miles 82K miles
Gathering
28K miles Gathering
21K miles
Figure 3.18 Chart describing the oil and gas distribution pipeline sector (7).
TABLE 3.2 Summary of Miles of Gas Distribution
Material Miles of Mains Number of Services
Steel 569,908 23,814,222
Plastic 461,433 28,506,127
Cast iron 46,023 51,090
Copper 52 1,497,638
Other 7,983 1,099,929
Total 1,085,399 54,969,006
83,864; services 99,024. The majority of the leaks were repaired without major inci-
dents. Only 26 major incidents caused by corrosion were reported during 1984–1999,
which resulted in $4,923,000 in property damage, 4 fatalities, and 16 injuries.
3.14 DRINKING WATER AND SEWER SYSTEMS
The forms of internal corrosion in water systems are uniform corrosion, galvanic
corrosion, localized corrosion, concentration cell corrosion, MIC, and erosion– cor-
rosion.
Major internal corrosion can occur in pipes made of cast iron, ductile iron, steel,
galvanized steel, and cement-based materials. Table 3.3 summarizes the types of
corrosion occurring in different piping materials and the possible tap water quality
problems caused by them, as described by the AWWA Research Foundation in 1996
in a reference book on internal corrosion of water distribution systems (17).
Negative health effects can result from corrosion of lead, corrosion of copper
alloys and solder in water supply systems, and corrosion of copper plumbing in
potable water systems.