
Page 179 - Challenges in Corrosion Costs Causes Consequences and Control(2015)
P. 179
TELECOMMUNICATIONS 157
Electricity
Water
flow
Dam
Power plant
Generator
Reservoir
Water Head
flow
Turbine
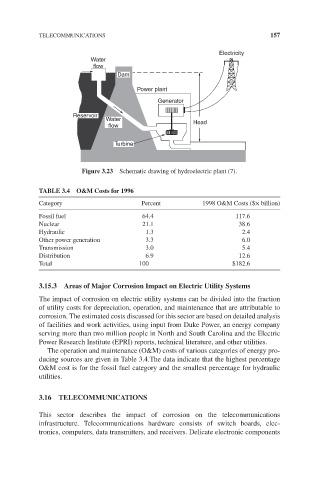
Figure 3.23 Schematic drawing of hydroelectric plant (7).
TABLE 3.4 O&M Costs for 1996
Category Percent 1998 O&M Costs ($× billion)
Fossil fuel 64.4 117.6
Nuclear 21.1 38.6
Hydraulic 1.3 2.4
Other power generation 3.3 6.0
Transmission 3.0 5.4
Distribution 6.9 12.6
Total 100 $182.6
3.15.3 Areas of Major Corrosion Impact on Electric Utility Systems
The impact of corrosion on electric utility systems can be divided into the fraction
of utility costs for depreciation, operation, and maintenance that are attributable to
corrosion. The estimated costs discussed for this sector are based on detailed analysis
of facilities and work activities, using input from Duke Power, an energy company
serving more than two million people in North and South Carolina and the Electric
Power Research Institute (EPRI) reports, technical literature, and other utilities.
The operation and maintenance (O&M) costs of various categories of energy pro-
ducing sources are given in Table 3.4.The data indicate that the highest percentage
O&M cost is for the fossil fuel category and the smallest percentage for hydraulic
utilities.
3.16 TELECOMMUNICATIONS
This sector describes the impact of corrosion on the telecommunications
infrastructure. Telecommunications hardware consists of switch boards, elec-
tronics, computers, data transmitters, and receivers. Delicate electronic components