
Page 146 - Chemical Process Equipment - Selection and Design
P. 146
118 FLOW OF FLUIDS
The pressure gradient accordingly is given by
+ 1.751. (6.111)
For example, when Dp = 0.005 m, G = 50 kg/m2 sec, g, =
1 kgm/N sec2, p = 800 kg/m3, p = 0.010 N sec/m2, and E = 0.4, the
gradient is AP/L = 0.31(105) Pa/m.
An improved correlation is that of Sato (1973) and Tallmadge
(AZChE J. 16, 1092 (1970)] shown on Figure 6.8(a). The friction
factor is
fp = 150/Rep + 4.2/Rey (6.112)
with the definitions of Eqs. (6.108) and (6.110). A comparison of
Eqs. (6.109) and (6.112) is
R=IJ 5 50 500 5000
6 (Ergun) 31.8 4.80 2.05 1.78
$(Sate) 33.2 5.19 1.79 1.05
In the highly turbulent range the disagreement is substantial.
TWO-PHASE FLOW
Operation of packed trickle-bed catalytic reactors is with liquid and la’ to’ 3x10’
gas flow downward together, and of packed mass transfer X
equipment with gas flow upward and liquid flow down. (b)
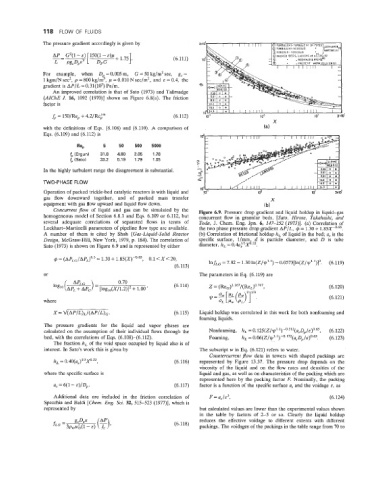
Concurrent flow of liquid and gas can be simulated by the Figure 6.9. Pressure drop gradient and liquid holdup in liquid-gas
homogeneous model of Section 6.8.1 and Eqs. 6.109 or 6.112, but concurrent flow in granular beds. [Sato, Hirose, Takahashi, and
several adequate correlations of separated flows in terms of Toda, J. Chem. Eng. Jpn. 6, 147-152 (1973)l. (a) Correlation of
Lockhart-Martinelli parameters of pipeline flow type are available. the two phase pressure drop gradient AP/L, C$ = 1.30 + 1.85X-0.85.
A number of them is cited by Shah (Gas-Liquid-Solid Reactor (b) Correlation of frictional holdup h, of liquid in the bed; a, is the
Design, McGraw-Hill, New York, 1979, p. 184). The correlation of specific surface, l/mm, d is particle diameter, and D is tube
Sato (1973) is shown on Figure 6.9 and is represented by either diameter. h, = 0.4aft3P.”.
r$ = (APLG/APL)o’5= 1.30+ 1.85(X)-0.85, 0.1 <X<20,
(6.113) 1nfLG = 7.82 - 1.30 h(z/v’.’) - 0.0573[h(Z/v’.’)]2. (6.119)
or The parameters in Eq. (6.119) are
(6.114) 2 = (ReG)’.167/(Re,)0.767, (6.120)
(6.121)
where
(6.115) Liquid holdup was correlated in this work for both nonfoaming and
foaming liquids.
The pressure gradients for the liquid and vapor phases are
calculated on the assumption of their individual flows through the Nonfoaming, hL = 0. 125(Z/y1.1)-o.312(a,Dp/~)o.6’, (6.122)
bed, with the correlations of Eqs. (6,108)-(6,112). Foaming, hL = 0.06(2/~1~1)-0.172(a,Dp/~)0~65.
(6.123)
The fraction h, of the void space occupied by liquid also is of
interest. In Sato’s work this is given by The subscript w in Eq. (6.121) refers to water.
Countercurrent flow data in towers with shaped packings are
h, = 0.40(as)1’3p ”, (6.116) represented by Figure 13.37. The pressure drop depends on the
viscosity of the liquid and on the flow rates and densities of the
where the specific surface is liquid and gas, as well as on characteristics of the packing which are
represented here by the packing factor F. Nominally, the packing
a, = 6(1- c)/Dp. (6.117) factor is a function of the specific surface a, and the voidage E, as
Additional data are included in the friction correlation of F = (6.124)
Specchia and Baldi [Chem. Eng. Sci. 32, 515-523 (1977)], which is
represented by but calculated values are lower than the experimental values shown
in the table by factors of 2-5 or so. Clearly the liquid holdup
reduces the effective voidage to different extents with different
(6.118)
packings. The voidages of the packings in the table range from 70 to