Page 343 - Chemical engineering design
P. 343

318
                                          10


                                          10 3 2        CHEMICAL ENGINEERING


                                       Viscosity mNs/m 2  10 1


                                          10 0


                                         10 −1

                                                 100      100      100      100      100
                                                                Temperature °C
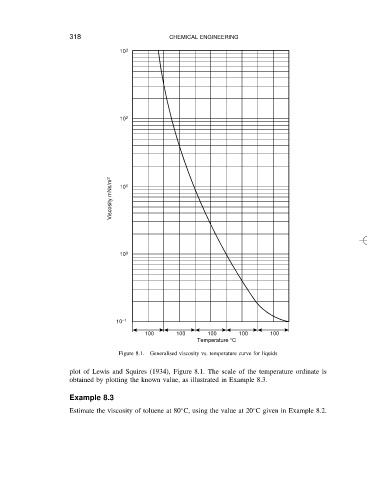
                                          Figure 8.1.  Generalised viscosity vs. temperature curve for liquids

                           plot of Lewis and Squires (1934), Figure 8.1. The scale of the temperature ordinate is
                           obtained by plotting the known value, as illustrated in Example 8.3.

                           Example 8.3
                                                                                Ž
                                                           Ž
                           Estimate the viscosity of toluene at 80 C, using the value at 20 C given in Example 8.2.
   338   339   340   341   342   343   344   345   346   347   348