
Page 344 - Chemical engineering design
P. 344
DESIGN INFORMATION AND DATA
Solution
Ž
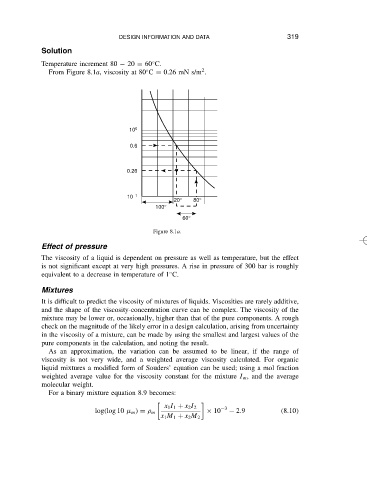
Temperature increment 80 20 D 60 C. 319
2
Ž
From Figure 8.1a, viscosity at 80 C D 0.26 mN s/m .
10 0
0.6
0.26
10 −1
20° 80°
100°
60°
Figure 8.1a.
Effect of pressure
The viscosity of a liquid is dependent on pressure as well as temperature, but the effect
is not significant except at very high pressures. A rise in pressure of 300 bar is roughly
Ž
equivalent to a decrease in temperature of 1 C.
Mixtures
It is difficult to predict the viscosity of mixtures of liquids. Viscosities are rarely additive,
and the shape of the viscosity-concentration curve can be complex. The viscosity of the
mixture may be lower or, occasionally, higher than that of the pure components. A rough
check on the magnitude of the likely error in a design calculation, arising from uncertainty
in the viscosity of a mixture, can be made by using the smallest and largest values of the
pure components in the calculation, and noting the result.
As an approximation, the variation can be assumed to be linear, if the range of
viscosity is not very wide, and a weighted average viscosity calculated. For organic
liquid mixtures a modified form of Souders’ equation can be used; using a mol fraction
weighted average value for the viscosity constant for the mixture I m , and the average
molecular weight.
For a binary mixture equation 8.9 becomes:
x 1 I 1 C x 2 I 2 3
log log 10 m D m ð 10 2.9 8.10
x 1 M 1 C x 2 M 2